. 2011 Apr 29;6(4):e19505.
doi: 10.1371/journal.pone.0019505.

Isolation and culture of larval cells from C. elegans

Affiliations

Isolation and culture of larval cells from C. elegans

Sihui Zhang et al. PLoS One. .

Abstract

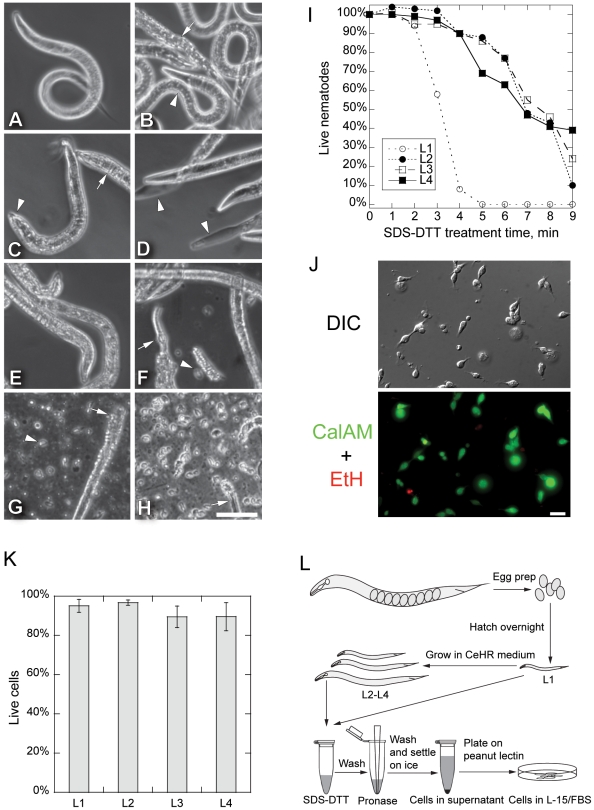
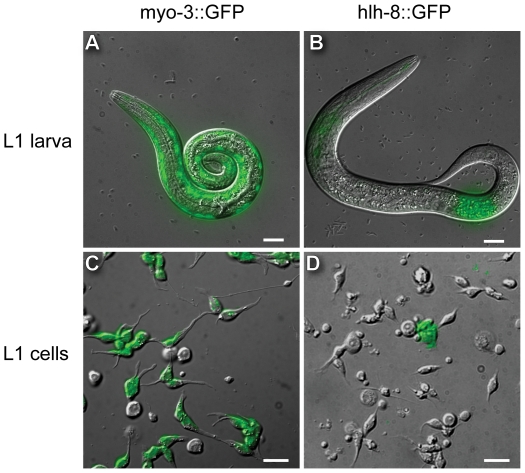
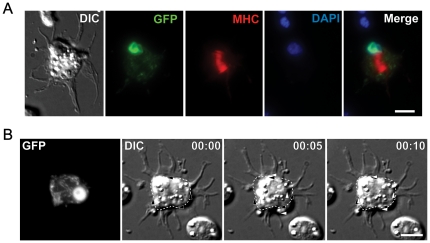
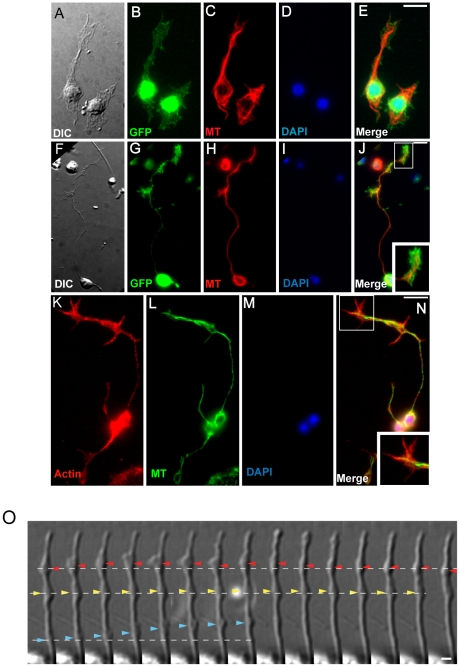
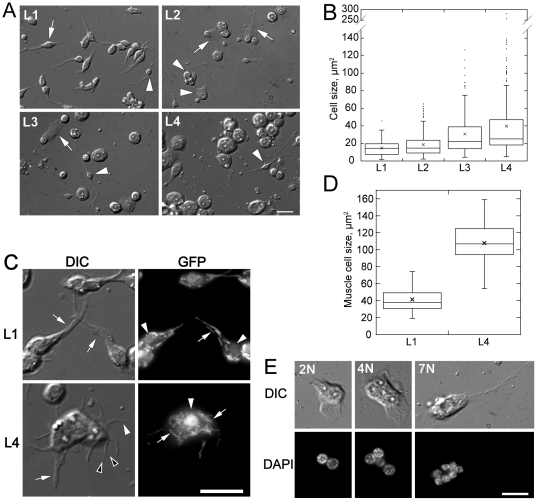
Cell culture is an essential tool to study cell function. In C. elegans the ability to isolate and culture cells has been limited to embryonically derived cells. However, cells or blastomeres isolated from mixed stage embryos terminally differentiate within 24 hours of culture, thus precluding post-embryonic stage cell culture. We have developed an efficient and technically simple method for large-scale isolation and primary culture of larval-stage cells. We have optimized the treatment to maximize cell number and minimize cell death for each of the four larval stages. We obtained up to 7.8×10(4) cells per microliter of packed larvae, and up to 97% of adherent cells isolated by this method were viable for at least 16 hours. Cultured larval cells showed stage-specific increases in both cell size and multinuclearity and expressed lineage- and cell type-specific reporters. The majority (81%) of larval cells isolated by our method were muscle cells that exhibited stage-specific phenotypes. L1 muscle cells developed 1 to 2 wide cytoplasmic processes, while L4 muscle cells developed 4 to 14 processes of various thicknesses. L4 muscle cells developed bands of myosin heavy chain A thick filaments at the cell center and spontaneously contracted ex vivo. Neurons constituted less than 10% of the isolated cells and the majority of neurons developed one or more long, microtubule-rich protrusions that terminated in actin-rich growth cones. In addition to cells such as muscle and neuron that are high abundance in vivo, we were also able to isolate M-lineage cells that constitute less than 0.2% of cells in vivo. Our novel method of cell isolation extends C. elegans cell culture to larval developmental stages, and allows use of the wealth of cell culture tools, such as cell sorting, electrophysiology, co-culture, and high-resolution imaging of subcellular dynamics, in investigation of post-embryonic development and physiology.


Conflict of interest statement

Competing Interests: The authors have declared that no competing interests exist.

Figures

Figure 1
Figure 1. Larval Cell Isolation Procedure.
(A–H) Phase contrast micrographs of L3 nematodes during cell isolation. (A) Untreated L3 worms had smooth body outlines and normal bending motion. (B) Nematodes treated with 15 mg/ml pronase for 20 min did not dissociate during repeated pipetting. Most nematodes remained intact (arrowhead), but some developed a rougher cuticle (arrow). (C) Nematodes treated with SDS-DTT for 4 min remained intact. Treated nematodes swelled slightly, especially at the head (arrowhead), and cuticle wrinkles appeared (arrow). However, nematodes continued to move. (D) Longer SDS-DTT treatment (8 min) killed nematodes. Some showed cuticle regions devoid of cells (arrowheads). (E) A short 4 min SDS-DTT treatment followed by repeated pipetting in egg buffer alone did not dissociate nematodes. (F) Adding pronase after a short SDS-DTT treatment (4 min) began to digest the cuticle. By 10 min, some nematodes lost cuticle integrity and released cells (arrowhead). Arrow points to an exposed pharynx in a partially digested worm. (G) Repeated pipetting during pronase digestion of SDS-DTT treated (4 min) nematodes over 20 min completely digested most worms. More cells were released (arrowhead) with pipetting than without. Some partially digested worms remained (arrow). (H) After digested worms were settled for 30 min on ice, the supernatant mostly contained cells and little nematode debris (arrow). Large worm debris but few cells settled into the pellet (not shown). Scale bar in A–H is 50 µm. (I) L2–L4 stage nematodes survived longer in SDS-DTT than did L1 nematodes. Nematodes were scored as dead if they were rigid without any bending activity or had dissolved leaving empty cuticles. Live/dead scores were normalized to worms incubated for 10 min in egg buffer (0 min). (J) DIC and fluorescence micrographs of live/dead cell assay of adherent larval cells one day after plating. Calcein-AM stains for live cells (green), and ethidium homodimer indicates dead cells (red). Scale bar: 10 µm. (K) Viability of adherent L1–L4 larval cells tested by Calcein-AM and ethidium homodimer staining one day after isolation. Error bar is SD of three observations (L1: n = 819; L2: n = 417; L3: n = 485; L4: n = 741). (L) Schematic diagram of larval cell isolation procedure. Eggs are isolated from gravid adults and hatched overnight. L1 larval cells are isolated immediately, while larvae are grown in CeHR medium for L2 to L4 stage cell isolation. Nematodes are treated with SDS and DTT for 2–4 min, washed with egg buffer, and incubated with pronase for 8–20 min with gentle pipetting. Cells were separated from debris by settling on ice for 30 min, plated onto penut lectin coated glass substrates and maintained in L-15/fetal bovine serum medium.
Figure 2
Figure 2. Fluorescent and DIC merge micrographs of muscle- or M-lineage-specific GFP expression in L1 larvae and L1 cell isolates.
(A) L1 worm of strain PD4251/myo-3::GFP, which has nuclear and mitochondrial GFP expression (green) in body wall muscle cells. (B) L1 worm of strain NH3402/hlh-8::GFP, which expresses membrane-bound GFP (green) in the M cell (posterior) and a small number of neuron-like cells in the head (anterior). Both animal heads are positioned to the left. (C) One-day culture of cells from L1 PD4251/myo-3::GFP. Green shows GFP expression in mostly bipolar, spindle-shaped muscle cells. (D) One-day culture of cells from L1 NH3402/hlh-8::GFP. Green shows GFP expression in a squamous-shaped M cell. All scale bars are 10 µm.
Figure 3
Figure 3. Muscle cells from L4 larvae express muscle-specific myosin and spontaneously contract in vitro.
(A) DIC and fluorescence micrographs of fixed muscle cells isolated from L4 stage myo3::GFP worms, which expresses GFP in both nucleus and mitochondria of muscle cells. Cells were immunostained for myosin heavy chain A (MHC-A), and stained for nuclei (DAPI). A wide band of myosin was observed near the cell center. (B) Time-lapse DIC series of spontaneous contraction in a muscle cell from myo3::GFP reporter strain. GFP indicates muscle identity. Dotted outlines show cell body shape as at 0 second, and are static throughout the sequence. Arrowheads show edges of cell body. Black arrowheads indicate initial boundary and are static throughout the sequence. White arrowheads indicate the newest cell edge positions. The overall cell shape changes from near rectangular (0 sec) to oval (5 sec) and back to near rectangular (10 sec). Time is in min∶sec. Scale bars are 5 µm.
Figure 4
Figure 4. Cultured larval neurons extend projections and growth cones in vitro.
(A–E) Microtubule network and cytoplasmic projections in GFP expressing cells isolated at L1 stage from an unc-119::GFP neuronal maker line. (A) DIC image of unc-119::GFP positive cells, (B) GFP expression in cell bodies (green), (C) anti-tubulin staining showing microtubules (red), (D) DAPI staining showing nuclei (blue), and (E) merged fluorescent images of fixed cells. (F–J) Microtubule network and cellular extensions in GFP expressing neurons after two days in culture. Staining as in A–E. (J) Enlarged inset shows a growth cone. (K–N) Actin and microtubule networks in neurons isolated from L1 stage N2/wildtype nematodes and fixed after 1 day. (K) Rhodamine-phalloidin staining for actin (red), (L) anti-tubulin staining for microtubules (green), (M) DAPI staining (blue), and (N) merged images. Enlarged inset in (N) shows actin enrichment in growth cone. Scale bars: 5 µm. (O) DIC time-lapse series of cellular activities in the dendrite-like extension process of a neuron isolated from L4 stage worms. Dotted lines represent baseline positions of each of three intracellular motilities. Red arrowheads: appearance and disappearance of a large protrusion. Yellow arrowheads: a relative static protrusion. Blue arrowheads: rapid forward movement of a protrusion. Interval between each frame is 5 sec. Scale bar: 1 µm.
Figure 5
Figure 5. Cell sizes increase and cell morphologies vary with larval stage.
(A) DIC micrographs of cells from L1–L4 worms one day after isolation (stage indicated in each panel). The fraction of large cells increases with progressive larval stages. Neurons (arrowheads) are found in cultures from all stages. Muscle is the major cell type in L1 isolates (arrow). Large cells from L2–L4 isolates are round with large flat protrusions (arrows). (B) Box and whisker plot of distribution of cell area of L1 (n = 205), L2 (n = 209), L3 (n = 176) and L4 (n = 238) cells one day after isolation. Central lines and boxes represent median and upper and lower quartiles of each distribution. Whiskers represent the robust range (quartiles±1.5x the interquartile distance). Means and outliers are show as crosses and dots. (C) DIC and fluorescence micrographs of L1 and L4 stage GFP positive cells isolated from myo-3::GFP strain, which expresses GFP in the nuclei and mitochrondria of muscle cells. DIC: L1 muscle cells have either one (arrows) or two (not shown) cell processes. L4 muscle cells show multiple cell processes, including wide (arrow), thin (white arrowhead) and bifurcated (black arrowheads) processes. GFP: Cells isolated from L1 and L4 show GFP expression in both nucleus (arrowhead) and mitochondria (arrows). (D) Box and whisker plot of distribution of cell area of L1 and L4 muscle cells (L1: n = 23; L4: n = 19). (E) DIC and fluorescence micrographs of fixed multinucleate (DAPI) cells from L4 isolates. Examples of 2, 4, and 7 nuclei (left to right) per cell are shown. All scale bars are 10 µm.

References

    1. Cowan AE, McIntosh JR. Mapping the distribution of differentiation potential for intestine, muscle, and hypodermis during early development in Caenorhabditis elegans. Cell. 1985;41:923–932. - PubMed
    1. Edgar LG, McGhee JD. DNA synthesis and the control of embryonic gene expression in C. elegans. Cell. 1988;53:589–599. - PubMed
    1. Goldstein B. Induction of gut in Caenorhabditis elegans embryos. Nature. 1992;357:255–257. - PubMed
    1. Bloom L. Genetic and molecular analysis of genes required for axon outgrowth in caenorhabditis elegans. 1993. PhD dissertation to Massachusetts Institute of Technology.
    1. Christensen M, Estevez A, Yin X, Fox R, Morrison R, et al. A primary culture system for functional analysis of C. elegans neurons and muscle cells. Neuron. 2002;33:503–514. - PubMed

Publication types