. 2011 Apr 29;6(4):e19452.
doi: 10.1371/journal.pone.0019452.

Improving the characterization of radiologically isolated syndrome suggestive of multiple sclerosis

Affiliations

Improving the characterization of radiologically isolated syndrome suggestive of multiple sclerosis

Nicola De Stefano et al. PLoS One. .

Abstract

Objective: To improve the characterization of asymptomatic subjects with brain magnetic resonance imaging (MRI) abnormalities highly suggestive of multiple sclerosis (MS), a condition named as "radiologically isolated syndrome" (RIS).

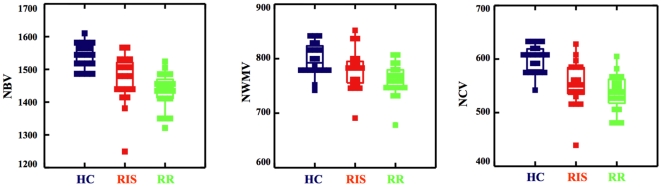
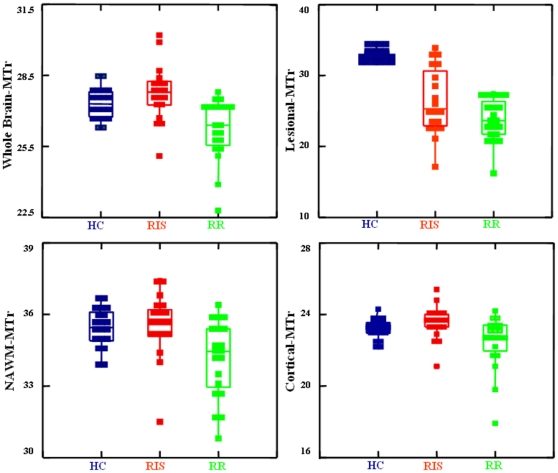
Methods: Quantitative MRI metrics such as brain volumes and magnetization transfer (MT) were assessed in 19 subjects previously classified as RIS, 20 demographically-matched relapsing-remitting MS (RRMS) patients and 20 healthy controls (HC). Specific measures were: white matter (WM) lesion volumes (LV), total and regional brain volumes, and MT ratio (MTr) in lesions, normal-appearing WM (NAWM) and cortex.

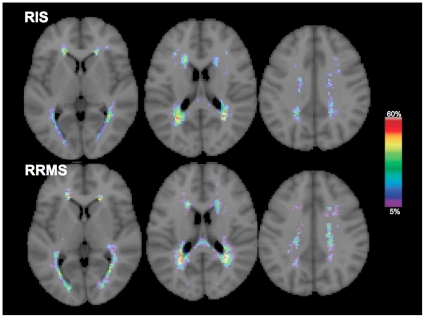
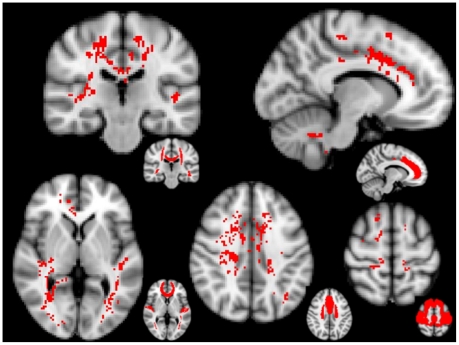
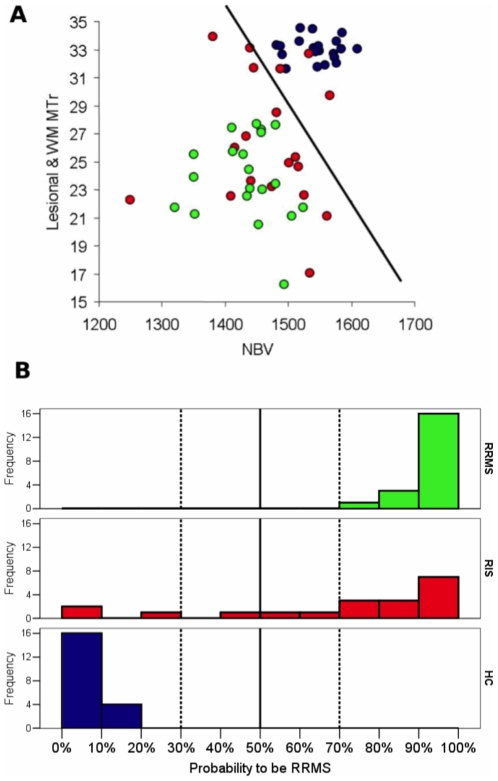
Results: LV was similar in RIS and RRMS, without differences in distribution and frequency at lesion mapping. Brain volumes were similarly lower in RRMS and RIS than in HC (p<0.001). Lesional-MTr was lower in RRMS than in RIS (p = 0.048); NAWM-MTr and cortical-MTr were similar in RIS and HC and lower (p<0.01) in RRMS. These values were particularly lower in RRMS than in RIS in the sensorimotor and memory networks. A multivariate logistic regression analysis showed that 13/19 RIS had ≥70% probability of being classified as RRMS on the basis of their brain volume and lesional-MTr values.

Conclusions: Macroscopic brain damage was similar in RIS and RRMS. However, the subtle tissue damage detected by MTr was milder in RIS than in RRMS in clinically relevant brain regions, suggesting an explanation for the lack of clinical manifestations of subjects with RIS. This new approach could be useful for narrowing down the RIS individuals with a high risk of progression to MS.


Conflict of interest statement

Competing Interests: We have read the journal's policy and have the following conflicts: N. De Stefano has received honoraria from Schering, Biogen-Dompè, Teva and Merck-Serono for consulting services, speaking and travel support and research grant support from the Italian MS Society. E. Portaccio has received honoraria for participating in Advisory Board from Biogen-Idec and research support from Merck Serono, Biogen-Idec, Bayer Schering and Sanofi Aventis. C. Gasperini has received fees as invited speaker from Bayer, Dompe', Merck Serono and Novartis. M.P. Sormani has received honoraria from Actelion, Biogen Idec, Teva and Merck-Serono for consulting services, speaking and travel support. M.P. Amato has received personal compensation from Merck Serono, Biogen Dompè, Sanofi Aventis, Bayer Schering for serving on scientific advisory board and for speaking and financial support for research activites from Merck Serono, Sanofi Aventis, Biogen Dompè, Bayer Schering. This does not alter our adherence to all the PLoS ONE policies on sharing data and materials as detailed online in the guide for authors. The other authors have no conflicts of interest.

Figures

Figure 1
Figure 1. T2-weighted lesion probability maps in RIS and RRMS.
The color overlay shows the probability of each voxel containing a lesion in each group. The color bar denotes the probability range. Background image is the MNI standard brain. In both groups, the areas with high probability of containing lesions were similar, mainly involving the superior and posterior regions of the corona radiata, the superior and inferior longitudinal fascicle and the body of the corpus callosum, with similar maximum peaks of lesion occurrence (RIS: 48%, RRMS: 54%). See text for abbreviations.
Figure 2
Figure 2. Brain volumes in HC, RIS and RRMS.
Box plots comparing the brain volumes of HC (left), RIS subjects (center) and RRMS patients (right). Values are relative to NBV (left), NWMV (center) and NCV (right). Note the presence of similarly low values of brain volume in RIS subjects and RRMS patients with respect to HC. See text for abbreviations.
Figure 3
Figure 3. MTr in HC, RIS and RRMS.
Box plots comparing the MTr measures of HC (left), RIS subjects (center) and RRMS patients (right). Values are relative to whole brain-MTr (top left), lesional-MTr (top right), NAWM-MTr (bottom left) and cortical-MTr (bottom right). Note the differences between the three groups, with generally higher MTr values in RIS subjects than in RRMS patients. See text for abbreviations.
Figure 4
Figure 4. Brain voxelwise MTr comparison between RIS and RRMS.
Red voxels show regions with significantly (p<0.05, cluster-corrected for multiple comparisons) lower MTr values in RRMS than in RIS. On smaller brains at the bottom right of each image, red shows the brain regions of the Harvard-Oxford GM atlas and DTI-based WM anatomy atlas corresponding to significant clusters. Background image is the MNI standard brain. Significant brain regions included the superior corona radiata, the body of corpus callosum and the inferior fronto-occipital fascicle (top-left image in coronal orientation); the paracingulate and cingulate gyri (top-right image in sagittal orientation); the inferior longitudinal fascicle, the planum temporale and the genu of corpus callosum (bottom-left image in axial orientation), the superior corona radiata and the paracingulate and cingulate gyri (bottom-center image in axial orientation); and the superior frontal, post- and precentral gyri (bottom-right image in axial orientation). See text for abbreviations.
Figure 5
Figure 5. Logistic regression analysis: probability for RIS to be HC or RRMS.
Panel A shows the distribution of subjects according to their NBV and lesional-WM MTr. HC are in blu, RIS subjects in red, and RRMS patients in green. Lesional-MTr values were calculated in RIS subjects and RRMS patients from T2-W lesional WM regions. MTr values in the WM of HC were calculated from areas homologous to those of the WM lesions of the RIS and RRMS. The black line separates the subjects with a probability of being a RRMS patient below and above 50%, according to the coefficients estimated by the penalized logistic model. The histogram of probability to be RRMS, as estimated according to the penalized logistic model including NBV and lesional-MTr as independent predictors, is reported in panel B. See text for further details.

References

    1. Morris Z, Whiteley WN, Longstreth WT, Jr, Weber F, Lee YC, et al. Incidental findings on brain magnetic resonance imaging: systematic review and meta-analysis. BMJ. 2009;339:b3016. - PMC - PubMed
    1. Sellner J, Schirmer L, Hemmer B, Muhlau M. J Neurol; 2010. The radiologically isolated syndrome: take action when the unexpected is uncovered? - PubMed
    1. Lebrun C, Bensa C, Debouverie M, Wiertlevski S, Brassat D, et al. Association between clinical conversion to multiple sclerosis in radiologically isolated syndrome and magnetic resonance imaging, cerebrospinal fluid, and visual evoked potential: follow-up of 70 patients. Arch Neurol. 2009;66:841–846. - PubMed
    1. Siva A, Saip S, Altintas A, Jacob A, Keegan BM, et al. Multiple sclerosis risk in radiologically uncovered asymptomatic possible inflammatory-demyelinating disease. Mult Scler. 2009;15:918–927. - PubMed
    1. Okuda DT, Mowry EM, Beheshtian A, Waubant E, Baranzini SE, et al. Incidental MRI anomalies suggestive of multiple sclerosis: the radiologically isolated syndrome. Neurology. 2009;72:800–805. - PubMed