. 2011 Apr 29;6(4):e19445.
doi: 10.1371/journal.pone.0019445.

Microspectroscopic evidence of cretaceous bone proteins

Affiliations

Microspectroscopic evidence of cretaceous bone proteins

Johan Lindgren et al. PLoS One. .

Abstract

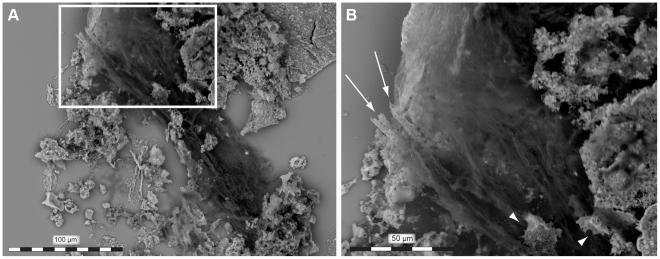
Low concentrations of the structural protein collagen have recently been reported in dinosaur fossils based primarily on mass spectrometric analyses of whole bone extracts. However, direct spectroscopic characterization of isolated fibrous bone tissues, a crucial test of hypotheses of biomolecular preservation over deep time, has not been performed. Here, we demonstrate that endogenous proteinaceous molecules are retained in a humerus from a Late Cretaceous mosasaur (an extinct giant marine lizard). In situ immunofluorescence of demineralized bone extracts shows reactivity to antibodies raised against type I collagen, and amino acid analyses of soluble proteins extracted from the bone exhibit a composition indicative of structural proteins or their breakdown products. These data are corroborated by synchrotron radiation-based infrared microspectroscopic studies demonstrating that amino acid containing matter is located in bone matrix fibrils that express imprints of the characteristic 67 nm D-periodicity typical of collagen. Moreover, the fibrils differ significantly in spectral signature from those of potential modern bacterial contaminants, such as biofilms and collagen-like proteins. Thus, the preservation of primary soft tissues and biomolecules is not limited to large-sized bones buried in fluvial sandstone environments, but also occurs in relatively small-sized skeletal elements deposited in marine sediments.


Conflict of interest statement

Competing Interests: The authors have declared that no competing interests exist.

Figures

Figure 1
Figure 1. Fibrous tissues and microstructures recovered from IRSNB 1624.
(A) Secondary electron micrograph of acid etched cortical bone showing fibrous tissues and what appears to be part of the osteocyte-lacunocanalicular system (osteocyte-like entities at arrows). (B) Osteocyte-like structure in lacuna within fibrous tissues. (C) Isolated osteocyte-like form visualized with fluorescent dye. (D) Topographic image of the same specimen as in C to illustrate the three-dimensional arrangement of the presumed cytoplasmic protrusions. (E, F) Light micrographs of fossil microstructures that are consistent in size and morphology to osteocytes or pericytes enfolding the outer surface of two vessel fragments. (G) Light micrograph of demineralized mosasaur bone tissues showing possible remains of the osteoid associated with vessel-like structures (C = cortex, M = medulla). (H) Light micrograph of an isolated fiber bundle. (I) TEM-image of demineralized mosasaur bone showing parallel-oriented fibrils. The spacing of the arrows indicates a 67 nm axial repeat D-banding pattern, which in modern bone is characteristic of collagen. (J) Transverse section (TEM-image) of a blood vessel from cortical bone of an extant monitor lizard humerus (LO 10298). Note the hair-like bone matrix fibers that are coiled around the canal wall. (K) Corresponding structures in the mosasaur humerus. (L) Histochemical staining of demineralized mosasaur bone suggesting the presence of connective tissue (blue) in the hair-like fibers that line a partially ruptured canal wall (the fracturing presumably occurred during the preparation of the sample). (M) Light micrograph (thin section) of untreated mosasaur bone showing fibers embedded in hydroxyapatite.
Figure 2
Figure 2. Amino acid content of IRSNB 1624 (two batches).
The majority of the amino acids present are aspartic acid, serine, glutamic acid, glycine, and alanine. Together, these amino acids make up approximately 60% of the residues in modern collagen . Additionally, the molecular composition of collagen incorporates glycine at every helical turn, resulting in a high concentration of this amino acid , . Low resolution and co-extraction contaminants prevented analysis of amino acids in the 440 nm region (such as proline and hydroxyproline).
Figure 3
Figure 3. In situ immunofluorescence of demineralized bone extracts of IRSNB 1624.
(A) With antibodies to type I collagen (diluted 1∶40). (B) With antibodies to type I collagen (diluted 1∶80). (C) No primary antibodies added (negative control). Although somewhat fragmented during the pre-treatment process, the samples presented in A and B still show reactivity against antibodies raised against type I collagen. The samples are illustrated as confocal section of immunofluorescence (left), Nomarski differential interference contrast, DIC (center), and combined immunofluorescence and DIC (right).
Figure 4
Figure 4. Vessel-like structures obtained from IRSNB 1624.
(A) Scanning electron micrograph of an isolated vessel-like structure comprised primarily of iron oxide. (B) Scanning electron micrograph of iron oxide crystals and oxidized pyrite framboids within a longitudinally sectioned vascular canal. (C) Transmission electron micrograph of iron oxide crystals lining the inside of a vessel wall.
Figure 5
Figure 5. Infrared spectra of mosasaur and Varanus fibrous tissues together with type I collagen.
(A) SEM-image of a partly demineralized fiber bundle isolated from IRSNB 1624 (white 10×10 µm square indicates measured area). (B) Synchrotron infrared spectrum (red) from the fiber bundle depicted in A together with a spectrum (blue) recorded with a 140×140 µm aperture (conventional light source) showing e.g., typical amide band frequencies and peaks attributed to phosphate and carbonate bands. Spectra from five arbitrary spatial regions were combined to produce the blue spectrum, and frequencies in the 1500–1750 cm−1 interval derive from the peak fit analysis presented in Figure 7A. *Uncertain assignment (see main text). (C) Infrared spectra of mosasaur and monitor lizard (LO 10298) tissues together with the compound signature for type I collagen. Note extreme similarities in the peak positions between the three spectra, and characteristic absorption peaks for the amide bands I–III and A. Spectra from five different regions were co-added to produce the type I collagen and monitor lizard spectra.
Figure 6
Figure 6. Infrared spectra of mosasaur and Varanus fibrous tissues, collagen and various microbial structures.
(A) Absorbance spectra of biofilms of Enterococcus faecalis and Propionibacterium acnes, isolated cells of the two bacteria, a collagen-like protein produced by Streptococcus pyogenes (SclB, as a fusion to GST), type I collagen, and fibrous tissues of Prognathodon (IRSNB 1624) and Varanus (LO 10298). Spectra from four different regions were co-added to produce the spectra for the microbial biofilms and planktonic cells (note, however, that the spectrum for P. acnes cells only includes three co-added spectra). The GST-ScIB spectrum consists of nine co-added spectra. Different numbers of spectra were used to obtain comparable signal-to-noise ratios. (B) Cluster analysis based on the spectral regions 1200–1800 and 2785–3730 cm−1 (peptide bond and lipid interval, respectively). Note that this is not a phylogeny. (C) Cluster analysis based on six arbitrary spatial regions from two samples of Prognathodon fibrous tissues (all having the same spectral resolution, 4 cm−1, and a similar signal-to-noise ratio) and six arbitrary spatial regions from two samples of Varanus osteoid.
Figure 7
Figure 7. Peak fit analysis of mosasaur and monitor lizard IR spectra.
(A) Peak fit analysis of the blue Prognathodon spectrum presented in Figures 5B, C and 6A. (B) Peak fit analysis of the Varanus spectrum shown in Figures 5C and 6A. The background of both spectra was subtracted using the Opus Concave rubber band correction method found in the Bruker OPUS 6.5 software package. Default values were used; i.e., 10 iterations and 64 baseline points. This correction marginally influenced peak fitting, positions and intensities, compared to those of a simple straight line subtraction, indicating a well-behaved and stable background. (C) Correlation diagram for frequencies obtained in the peak fit analyses of the Prognathodon and Varanus spectra.
Figure 8
Figure 8. Partially mineralized fiber bundle obtained from IRSNB 1624.
(A) Scanning electron micrograph of a partly mineralized fiber bundle located in between mineralized fragments of vessel-like structures. (B) Close up of the area marked in A showing partly mineralized fibers (arrows – note transition from mineralized to organic part of the fibers) and osteocyte-like entities (arrowheads).

References

    1. Zhang F, Kearns SL, Orr PJ, Benton MJ, Zhou Z, et al. Fossilized melanosomes and the colour of Cretaceous dinosaurs and birds. Nature. 2010;463:1075–1078. - PubMed
    1. Lindgren J, Caldwell MW, Konishi T, Chiappe LM. Convergent evolution in aquatic tetrapods: insights from an exceptional fossil mosasaur. PLoS ONE. 2010;5(8):e11998. doi: 10.1371/journal.pone.0011998. - DOI - PMC - PubMed
    1. Buckley M, Walker A, Ho SYW, Yang Y, Smith C, et al. Comment on “Protein sequences from mastodon and Tyrannosaurus rex revealed by mass spectrometry”. Science. 2008;319:33c. - PMC - PubMed
    1. Kaye TG, Gaugler G, Sawłowicz Z. Dinosaurian soft tissues interpreted as bacterial biofilms. PLoS ONE. 2008;3(7):e2808. doi: 10.1371/journal.pone.0002808. - DOI - PMC - PubMed
    1. Asara JM, Schweitzer MH, Freimark LM, Phillips M, Cantley LC. Protein sequences from mastodon and Tyrannosaurus rex revealed by mass spectrometry. Science. 2007;316:280–285. - PubMed

Publication types

MeSH terms

LinkOut - more resources