. 2011 Apr 29;6(4):e19366.
doi: 10.1371/journal.pone.0019366.

Interferon-alpha triggers B cell effector 1 (Be1) commitment

Affiliations

Interferon-alpha triggers B cell effector 1 (Be1) commitment

Marie-Ghislaine de Goër de Herve et al. PLoS One. .

Abstract

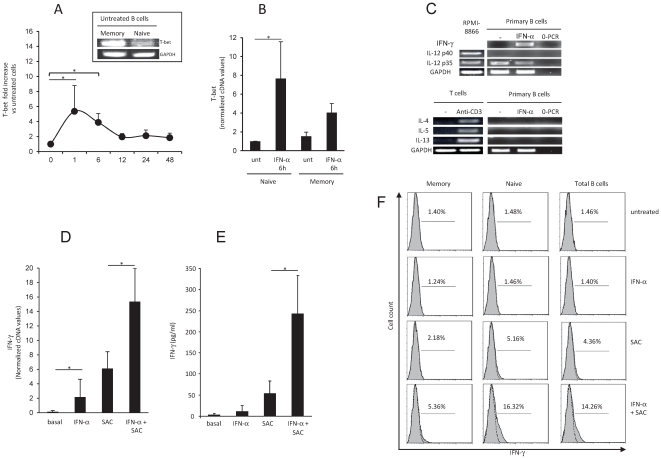
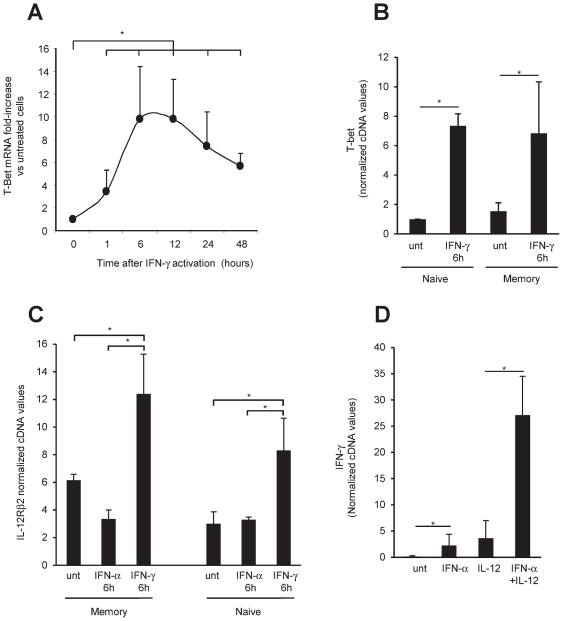
B-cells can contribute to the pathogenesis of autoimmune diseases not only through auto-antibody secretion but also via cytokine production. Therapeutic depletion of B-cells influences the functions and maintenance of various T-cell subsets. The mechanisms governing the functional heterogeneity of B-cell subsets as cytokine-producing cells are poorly understood. B-cells can differentiate into two functionally polarized effectors, one (B-effector-1-cells) producing a Th-1-like cytokine pattern and the other (Be2) producing a Th-2-like pattern. IL-12 and IFN-γ play a key role in Be1 polarization, but the initial trigger of Be1 commitment is unclear. Type-I-interferons are produced early in the immune response and prime several processes involved in innate and adaptive responses. Here, we report that IFN-α triggers a signaling cascade in resting human naive B-cells, involving STAT4 and T-bet, two key IFN-γ gene imprinting factors. IFN-α primed naive B-cells for IFN-γ production and increased IFN-γ gene responsiveness to IL-12. IFN-γ continues this polarization by re-inducing T-bet and up-regulating IL-12Rβ2 expression. IFN-α and IFN-γ therefore pave the way for the action of IL-12. These results point to a coordinated action of IFN-α, IFN-γ and IL-12 in Be1 polarization of naive B-cells, and may provide new insights into the mechanisms by which type-I-interferons favor autoimmunity.


Conflict of interest statement

Competing Interests: The authors have declared that no competing interests exist.

Figures

Figure 1
Figure 1. IFN-α induces STAT4 activation in human B cells.
In 1A, IFNAR1 and IFNAR2 expression was analyzed in the CD3CD19+CD27+ and CD3CD19+CD27 lymphocyte gates. A representative staining profile is shown in the left-hand graph. The right-hand graph represents corrected mean fluorescence intensities (MFI) of IFNAR1 and IFNAR2 after substraction of MFI values obtained in isotype control in naive (CD27) and memory (CD27+) B cell subsets. The results correspond to the mean ± SEM of the values obtained with cells from 6 healthy donors. 1B shows the purity of B cell preparations (see methods). In 1C, purified B cells were activated with IFN-α for 1 h then lysed. Western blotting was performed on whole-cell lysates by using anti-phospho-STAT2, and the membranes were reprobed with anti-STAT2. The data shown in 1C are representative of 2 independent experiments. 1D, left panel: B cells were activated for 1 hour with IFN-α. Western blotting was performed on whole-cell lysates by using anti-phospho-STAT1 or anti-phospho-STAT4. The membranes were then reprobed with anti-STAT1 or anti-STAT4. The data shown in 1D, left panel are representative of 2 independent experiments. 1D, right panel: B cells were activated with IFN-α for 1 hour or left untreated. They were then fixed, permeabilized, and stained with anti-STAT4 or anti-STAT1 (green) plus propidium iodide (nuclear staining, red). Nuclear translocation was examined by confocal microscopy. Yellow spots indicate nuclear STAT. Similar results were obtained in three other experiments. In 1E, the kinetics of STAT1 and STAT4 phosphorylation was analyzed in B cells by flow cytometry with phospho-STAT-specific antibodies. A representative staining profile is shown in the left-hand graph. The right-hand graph represents corrected mean fluorescence intensities (MFI), after subtraction of MFI values obtained in isotype controls, of phospho-STAT1 and phospho-STAT4 in B cells. The data shown in 1E are the mean ± SEM for cells from 4 healthy donors.
Figure 2
Figure 2. IFN-α induces T-bet expression in B cells and primes B cells for IFN-γ production.
In 2A, T-bet mRNA expression at rest, assessed by RT-PCR, in untreated sorted naive and memory B cell subsets is shown. T-Bet expression was also quantitatively analyzed quantitative RT-PCR in total B cells after IFN-α treatment. Results are expressed as fold increases versus untreated total B cells. In 2B, T-bet mRNA expression was analyzed in sorted naive and memory B cell subsets after IFN-α treatment for 6 hours. 2C, B cells were treated for 24 h with IFN-α, and cDNAs were amplified with primers for IFN-γ, IL-12 p40, IL-12 p35, IL-4, IL-5, IL-13 and GAPDH. Positive controls consisted of the EBV-transformed B cell line RPMI-8866 (which constitutively expresses IL-12p35 and IL-12p40) and anti-CD3-activated T cells. 2D, 2E: B cells pretreated with IFN-α for 18 hours were treated with SAC for 24 hours (for mRNA quantification, 2D) or 48 hours (for ELISA, 2E). The corresponding cDNA and supernatants were assayed for IFN-γ expression by quantitative PCR and ELISA, respectively. Fig. 2F shows IFN-γ expression in naive and memory B cell subsets after IFN-α pretreatment and SAC activation for 12 hours, as determined with flow cytometry. Dashed lines correspond to isotype control. Data are representative of 4 different donors (2C, 2F) or are mean± SEM of 6 to 7 different donors (2A, 2B, 2D, 2E). Statistically significant differences are indicated by an asterisk.
Figure 3
Figure 3. IFN-α increased IFN-γ gene responsiveness to IL-12. 3A, B cells were treated for various times with IFN-γ, and T-bet mRNA was quantified by RT-PCR.
The results are expressed as -fold increases versus untreated cells. 3B: T-bet mRNA -fold increases are shown for the naive and memory subsets at the 6-hour time point. 3C: Purified naive and memory B cells were activated for 6 hours with IFN-α or IFN-γ. IL-12Rβ2 mRNA expression was analyzed by quantitative PCR. 3D: B cells were pretreated with IFN-α for 18 h and treated with IL-12 for 24 h, then IFN-γ and GAPDH cDNAs were quantified by PCR. The results are mean ± SEM of values obtained with cells from 4 (3B, 3C) or 6 (3A, 3D) donors. Statistically significant differences are indicated by asterisks.

References

    1. Lund FE. Cytokine-producing B lymphocytes-key regulators of immunity. Curr Opin Immunol. 2008;20:332–338. - PMC - PubMed
    1. Pistoia V. Production of cytokines by human B cells in health and disease. Immunol Today. 1997;18:343–350. - PubMed
    1. Bouaziz JD, Yanaba K, Tedder TF. Regulatory B cells as inhibitors of immune responses and inflammation. Immunol Rev. 2008;224:201–214. - PubMed
    1. Mizoguchi A, Bhan AK. A case for regulatory B cells. J Immunol. 2006;176:705–710. - PubMed
    1. Lund FE, Randall TD. Effector and regulatory B cells: modulators of CD4(+) T cell immunity. Nat Rev Immunol. 2010;10:236–247. - PMC - PubMed