

Flexible search for single-axon morphology during neuronal spontaneous polarization
- PMID: 21559492
- PMCID: PMC3084731
- DOI: 10.1371/journal.pone.0019034
Flexible search for single-axon morphology during neuronal spontaneous polarization
Abstract
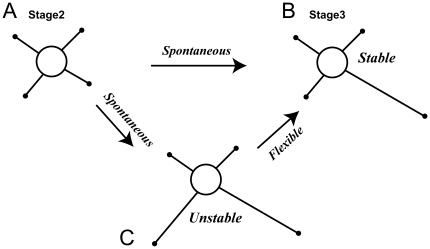
Polarization, a disruption of symmetry in cellular morphology, occurs spontaneously, even in symmetrical extracellular conditions. This process is regulated by intracellular chemical reactions and the active transport of proteins and it is accompanied by cellular morphological changes. To elucidate the general principles underlying polarization, we focused on developing neurons. Neuronal polarity is stably established; a neuron initially has several neurites of similar length, but only one elongates and is selected to develop into an axon. Polarization is flexibly controlled; when multiple neurites are selected, the selection is eventually reduced to yield a single axon. What is the system by which morphological information is decoded differently based on the presence of a single or multiple axons? How are stability and flexibility achieved? To answer these questions, we constructed a biophysical model with the active transport of proteins that regulate neurite growth. Our mathematical analysis and computer simulation revealed that, as neurites elongate, transported factors accumulate in the growth cone but are degraded during retrograde diffusion to the soma. Such a system effectively works as local activation-global inhibition mechanism, resulting in both stability and flexibility. Our model shows good accordance with a number of experimental observations.
Conflict of interest statement
Figures
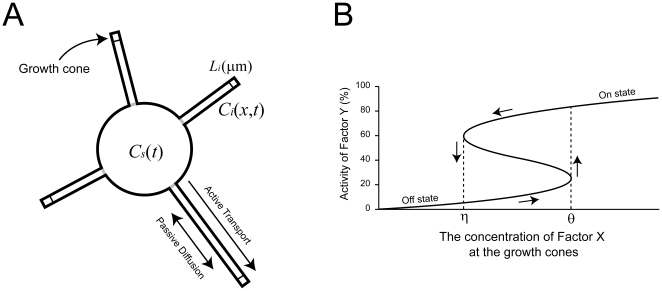
 denotes the concentration of factor X in the soma at time t, and
  denotes the concentration of factor X at x µm from the neck of neurite i at time t.
  is the length of neurite i. (B) The axon is specified according to the activity of factor Y at the growth cone. Factor Y activity depends on the concentration of factor X but also has hysteresial behavior. Between the threshold concentrations of η and θ, the system exhibits bistability with one unstable and two stable states (on and off states). When factor Y is in the on state, the neurite elongates, and when factor Y is in the off state, the neurite shrinks.
 ,
,  ,
,  ,
,  ,
,  ,
,  ,
,  ,
,  ,
,  and
and  . A neurite was assumed to elongate to 100 µm if factor Y switches to the on state in the corresponding growth cone.
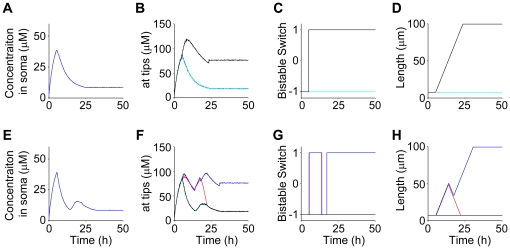
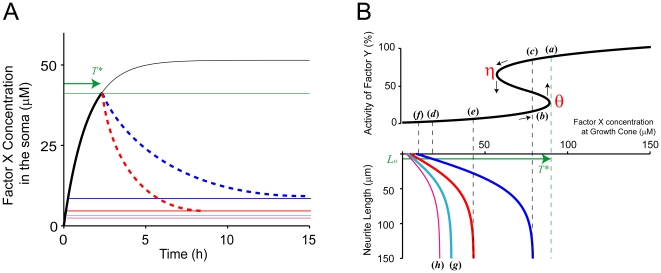
 ). The rates of neurite growth and shrinkage are set to
  and
and  , respectively. (A–D) Typical simulation results showing a direct transition from an initial state to a single-axon state, depicted as a transition from state (A) to state (B) in Figure 1. (E–H) Typical simulation result showing an indirect transition from an initial state to a single-axon state via a two-axon state, depicted as a transition from state (A) to state (B) via state (C) in Figure 1. Time courses of the concentration of factor X in the soma (A, E), at growth cones (B, F), state of factor Y (C, G) and neurite lengths (D, H) are shown. Note that four curves with different colors are plotted in (B–D, F–H) to correspond to four neurites, although distinguishing them in some cases is difficult. The other parameters used in this simulation were the same as those in Figure 4.
References
-
- Bradke F, Dotti CG. The role of local actin instability in axon formation. Science. 1999;283:1931–1934. - PubMed
-
- Arimura N, Kaibuchi K. Neuronal polarity: from extracellular signals to intracellular mechanisms. Nat Rev Neurosci. 2007;8:194–205. - PubMed
-
- Bradke F, Dotti CG. Neuronal polarity: vectorial cytoplasmic flow precedes axon formation. Neuron. 1997;19:1175–1186. - PubMed
Publication types
MeSH terms
LinkOut - more resources
Full Text Sources
