

A computational model of the ionic currents, Ca2+ dynamics and action potentials underlying contraction of isolated uterine smooth muscle
- PMID: 21559514
- PMCID: PMC3084699
- DOI: 10.1371/journal.pone.0018685
A computational model of the ionic currents, Ca2+ dynamics and action potentials underlying contraction of isolated uterine smooth muscle
Erratum in
- PLoS One. 2011;6(10). doi: 10.1371/annotation/d317e049-4927-4906-95a5-cd0198a3feb9. Karche, Sanjay [corrected to Kharche, Sanjay] doi: 10.1371/annotation/d317e049-4927-4906-95a5-cd0198a3feb9
Abstract
Uterine contractions during labor are discretely regulated by rhythmic action potentials (AP) of varying duration and form that serve to determine calcium-dependent force production. We have employed a computational biology approach to develop a fuller understanding of the complexity of excitation-contraction (E-C) coupling of uterine smooth muscle cells (USMC). Our overall aim is to establish a mathematical platform of sufficient biophysical detail to quantitatively describe known uterine E-C coupling parameters and thereby inform future empirical investigations of physiological and pathophysiological mechanisms governing normal and dysfunctional labors. From published and unpublished data we construct mathematical models for fourteen ionic currents of USMCs: Ca2+ currents (L- and T-type), Na+ current, an hyperpolarization-activated current, three voltage-gated K+ currents, two Ca2+-activated K+ current, Ca2+-activated Cl current, non-specific cation current, Na+-Ca2+ exchanger, Na+-K+ pump and background current. The magnitudes and kinetics of each current system in a spindle shaped single cell with a specified surface area:volume ratio is described by differential equations, in terms of maximal conductances, electrochemical gradient, voltage-dependent activation/inactivation gating variables and temporal changes in intracellular Ca2+ computed from known Ca2+ fluxes. These quantifications are validated by the reconstruction of the individual experimental ionic currents obtained under voltage-clamp. Phasic contraction is modeled in relation to the time constant of changing [Ca2+]i. This integrated model is validated by its reconstruction of the different USMC AP configurations (spikes, plateau and bursts of spikes), the change from bursting to plateau type AP produced by estradiol and of simultaneous experimental recordings of spontaneous AP, [Ca2+]i and phasic force. In summary, our advanced mathematical model provides a powerful tool to investigate the physiological ionic mechanisms underlying the genesis of uterine electrical E-C coupling of labor and parturition. This will furnish the evolution of descriptive and predictive quantitative models of myometrial electrogenesis at the whole cell and tissue levels.
Conflict of interest statement
Figures
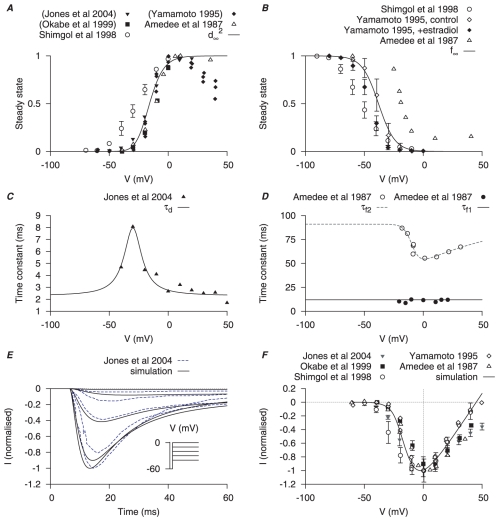
 are derived from experimental data of myometrial longitudinal cells from late pregnant rat , , , , , . A, voltage (V)-dependent activation steady-state (
 ); experimental data in brackets were extrapolated from current-voltage (I–V) relationships using the function
  and normalized to the maximum value. B, V-dependent inactivation steady-state (
 ). C, V-dependent activation time constant (
 ); extracted by fitting current tracings from Jones et al.
. D, V-independent fast inactivation time constant (
); extracted by fitting current tracings from Jones et al.
. D, V-independent fast inactivation time constant ( , solid circles) and V-dependent slow inactivation time constant (
 , empty circles). E, simulated voltage-clamp
  at voltage steps of
  to
to  from a holding potential of
  are superimposed on experimental current tracings from Jones et al., ; F, simulated peak I–V relationship of
  together with different experimental I–V data. In both E and F, all data are normalized to the peak current value at
  .
.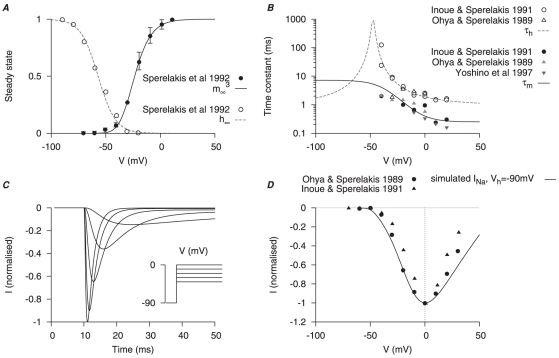
 are derived from experimental data of myometrial longitudinal cells , , , from late pregnant rats. A, V-dependent steady-states of activation (
 ) and inactivation (
 ); B, V-dependent time constants of activation (
 ) and inactivation (
 ). In both A and B, solid and empty circles are experimental data for activation and inactivation respectively. C, simulated
  at voltage steps of
  to
to  from a
  of
of  ; D, simulated peak I–V relationship of
  at
at  and experimental I–V data. In both C and D, all data are normalized to the peak current value at
  .
.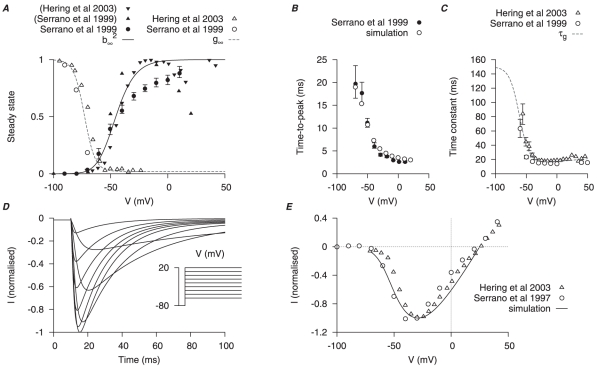
 are derived primarily from experimental data of Serrano et al., and Hering et al., . A, V-dependent steady-states of activation (
 ) and inactivation (
 ); experimental data in brackets were extrapolated from the published I–V relationships and normalized to the maximum value. B, superimposed simulated and experimental time-to-peak of
  at different V stepped from
  of
of  ; a function for the V-dependent activation time constant is chosen so that the simulated time-to-peak (empty circles) matched the experimental data (solid circle). C, V-dependent inactivation time constant (
 ). D, simulated
  at voltage steps of
  to
to  from a
  of
of  ; E, simulated peak I–V relationship of
  and experimental I–V data. In both D and E, all data are normalized to the peak current value at
  .
.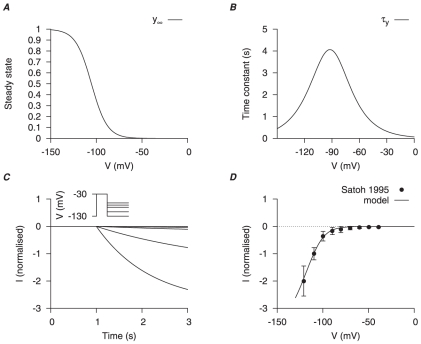
 are derived from experimental data of Okabe et al., in rat circular myometrial cells and adjusted to experimental data of longitudinal cells . A, V-dependent activation steady-state (
 ); B, V-dependent activation time constant (
 ). C, simulated voltage-clamp
  at voltage steps of
  to
to  from a holding potential of
  . D, simulated I–V relationship of
  and experimental I–V data Satoh . In both C and D, all data are normalized to the current value at
  .
.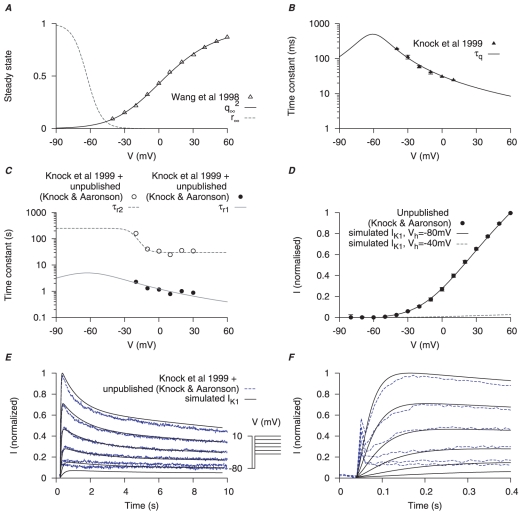
 are derived from experimental data of myometrial longitudinal cells in late pregnant rats ; the kinetics are from myometrial cells in late pregnant women from Knock et al., and Knock G & Aaronson P (personal communication, including unpublished time tracings - see Figure S4). A, V-dependent steady-states of activation (
 ) and inactivation (
 ). B, V-dependent activation time constants (
 ). C, V-dependent fast (
 ) and slow (
 ) inactivation time constants. The experimental fast (solid circles) and slow (empty circles) inactivation time constants were extracted by fitting voltage-clamp time tracings averaged from five cells (1 published and 4 unpublished with the average values labeled as ‘Knock et al 1999+unpublished (Knock & Aaronson)’ in the figure). D, simulated I–V relationship of
  from holding potentials of
  and
and  with
with  and
and  ; all values are normalized to the peak current at
  from
from  . E, simulated time tracings and averaged raw data of
  at voltage steps of
  to
to  from
from  of
of  ; both simulated and experimental currents are normalized to the peak current at
  ; F, enlarged E showing activation of
  during the first few hundred milli-seconds.
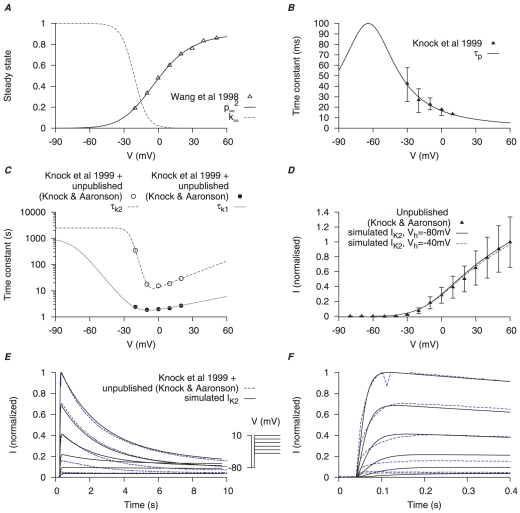
 are derived from experimental data of myometrial longitudinal cells in late pregnant rats ; the kinetics are extracted from raw data tracings from myometrial cells of late pregnant women from Knock et al., and Knock G & Aaronson P (personal communication, including unpublished time tracings - see Figure S5). A, V-dependent steady-states of activation (
 ) and inactivation (
 ). B, V-dependent activation time constants (
 ) C, V-dependent fast (
 ) and slow (
 ) inactivation time constants. The experimental fast (solid circles) and slow (empty circles) inactivation time constants were extracted from voltage-clamp time tracings averaged from four cells (1 published and 3 unpublished with the average values labeled as ‘Knock et al 1999+unpublished (Knock & Aaronson)’ in the figure. D, simulated I–V relationship of
  from a holding potential of
  and
and  with
with  and
and  ; all values are normalized to the peak current at
  from
from  . E, simulated time tracings of
  at voltage steps of
  to
to  from a holding potential of
  ; both simulated and experimental currents are normalized to the peak current at
  ; F, enlarged E showing activation of
  during the first few hundred milli-seconds.
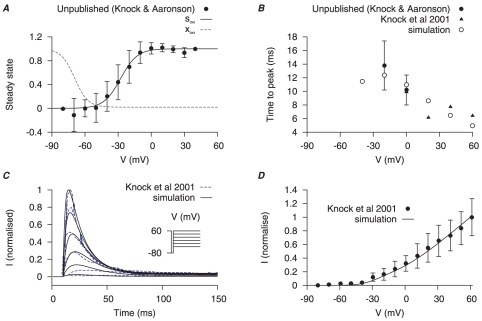
 are derived from experimental data of myometrial cells from Knock et al., , and Knock G & Aaronson P (unpublished data, personal communication) in late pregnant women. Functions for V-dependent activation and inactivation time constants are chosen so that the simulated time-to-peak, current tracings and I–V relationship matched the experimental data. A, V-dependent steady-states of activation (
 ) and inactivation (
 ). B, simulated (empty points) and experimental (solid points) time-to-peak of
  at different V stepped from a
  of
of  . C, simulated voltage-clamp
  at voltage steps of
  to
to  from a holding potential of
  are superimposed on experimental current tracings from Knock et al., ; F, simulated peak I–V relationship of
  and experimental I–V data. In both E and F, all data are normalized to the peak current value at
  .
.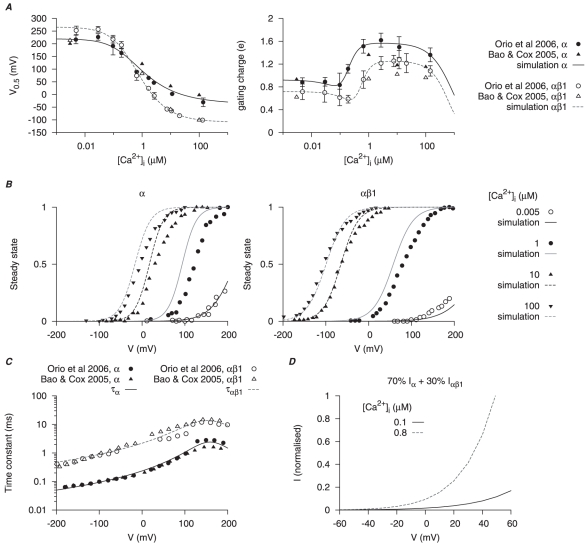
 ), voltage- (V) and time-dependent kinetics for the two types of
  currents,
  and
and  , are developed with experimental data from cloned mammalian myometrial and smooth muscle MaxiK
  and
and  subunits expressed in Xenopus laevis oocytes , ; the current density and proportion of
  are adjusted with I–V relationships from different mammalian myometrial cells , , . In A and C, solid and empty circles are experimental data for
  and
and  respectively. A,
  -dependent half-activation (
 ) and activation gating charge. B, simulated activation steady-states for
  and
and  at different
  ; solid and empty circles are experimental data from Orio et al., and Bao & Cox respectively. C, V-dependent activation time constants for
  and
and  . D, simulated I–V relationships of
  at anticipated myometrial resting and peak
  levels, with the proportion of
  . Both I–V relationships are normalized to
  at
at  at peak
  level.
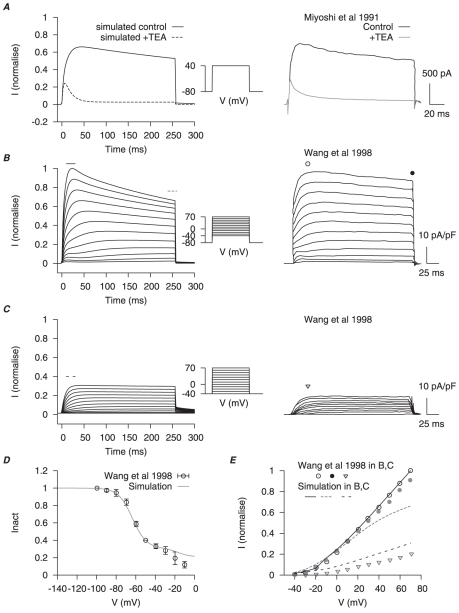
 ,
,  ,
,  ,
,  and
and  were combined to simulate the whole cell
  data of Miyoshi et al., and Wang et al., . A, simulated effects of
  TEA (left), which blocks
  ,
,  and
and  but not
  , at a voltage step of
  from a holding potential (
 ) of
) of  ; corresponding experimental results (right). B, simulated whole cell potassium currents (left) and corresponding experimental results (right) at voltage steps from
  to
to  from a
  of
of  ; and C, from a
  of
of  . D, simulated inactivation of whole cell potassium currents with the same two-step protocol in Wang et al., :
  , followed with a
  conditional step ranging from
  to
to  , then a final test step at
  for
for  . The peak current during the the test steps is normalized to test step at
  . E, the I–V relationships at peak and at the end of the voltage step in B and C. In B and C, simulated currents are normalized to the peak current at
  from
from  .
.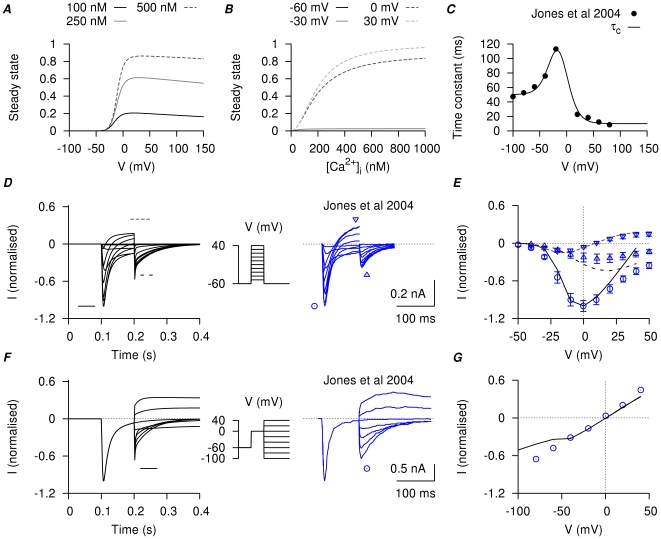
 is modified from Arreola et al., . A, steady-state of
  with respect to V in three different
  concentrations; B, steady-state of
  with respect to
  at four different membrane potentials. C, V-dependent activation time constant; the experimental data points are obtained by fitting the tail currents in figure 2 of Jones et al., . D, simulated currents (left) and the corresponding experimental currents in Jones et al., (right) elicited by a single-step voltage-clamp protocol (inset). The peak of the inward currents, the current values at the end of the voltage pulse, and the peak of the tail currents were marked for both simulated current (lines) and experimental current tracings (circles). E, I–V relationships, showing the marked peak at each voltage step in D. F, simulated currents (left) and the corresponding experimental currents in Jones et al., (right) by a two-step voltage-clamp protocol (inset). The peak of the tail currents were marked for both simulated current (lines) and experimental current tracings (circles). G, I–V relationships, showing the marked peaks of the tail currents at each voltage step in F. The simulated currents qualitatively reproduced the experimental current tracings in both voltage-clamp protocols, with almost zero net current at the holding potential and comparable amplitude and rate of decay of the tail currents.
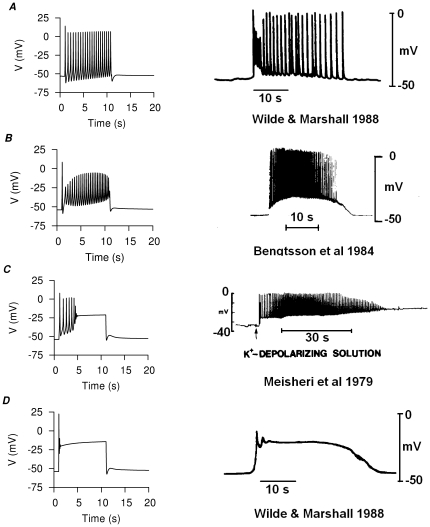
 stimulus applied at
  . Representative experimental APs from published recordings , , are shown for comparison (right). A, bursting type AP with afterpotentials at resting membrane potential (RMP); B, bursting type AP with depolarized afterpotentials; C, a mixed bursting-plateau type AP with initial repetitive spikes that gradually become a flat plateau at
  . D, plateau type AP.
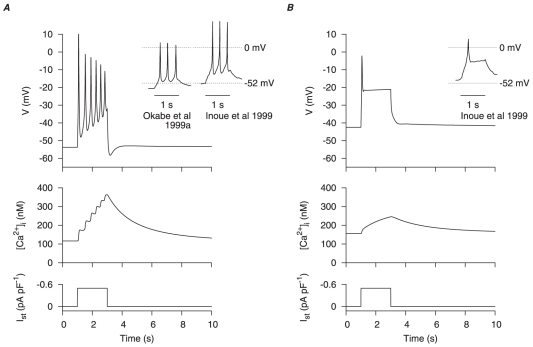
 ) and corresponding calcium transients (
 ) during a
  depolarizing current clamp (
 ) under, A, control conditions and, B, the effects of estradiol. In both cases, the initial conditions of the cell model were at their corresponding numerical equilibrium. Action potentials in rat longitudinal myometrial single cells under similar experimental conditions , are shown for comparison (insets).
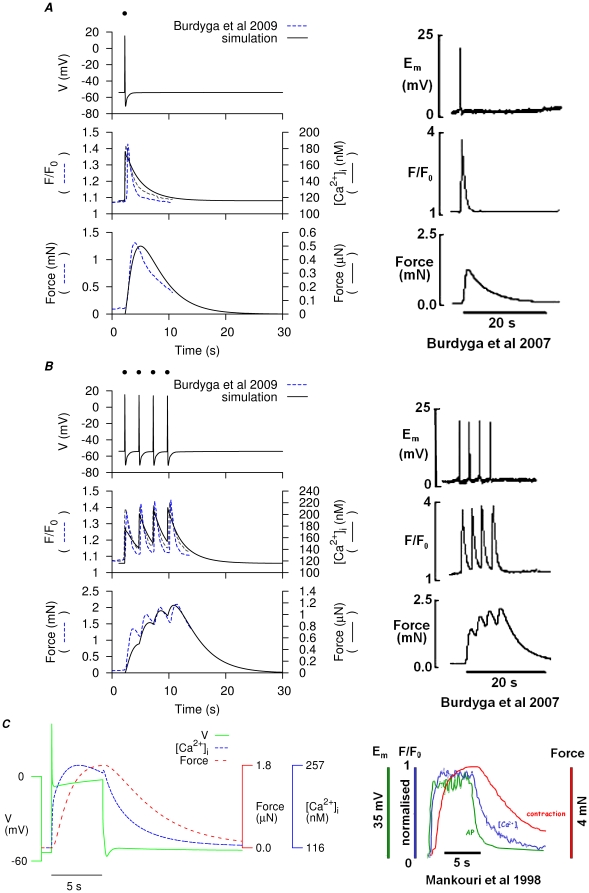
 and force (left) compared to experimental simultaneous measurements of membrane potential,
  and force in rat myometrial tissue strips. A, simulation of a single spike AP and corresponding
  and force induced by a
  stimulus (dot) at
  and compared to experimental data , . B, four consecutive single spike APs and corresponding
  and force modeled by
  stimuli (dots) of
  , applied at
  and compared to experimental data , . C, superimposed simulated AP,
  and force development (left), with a
  current clamp at
  and compared to experimental data .
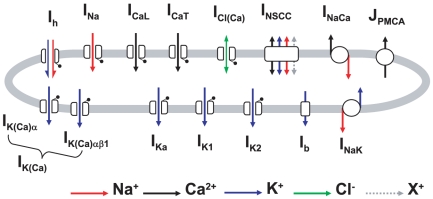
References
-
- Landa J, West TC. Transmembrane potentials and contractility in the pregnant rat uterus. Am J Physiol. 1956;187:333–337. - PubMed
-
- Landa JF, West TC, Thiersch JB. Relationships between contraction and membrane electrical activity in the isolated uterus of the pregnant rat. Am J Physiol. 1959;196:905–909. - PubMed
Publication types
MeSH terms
Substances
Grants and funding
LinkOut - more resources
Full Text Sources
Miscellaneous
