Review
. 2011 Sep;29(9):435-42.
doi: 10.1016/j.tibtech.2011.04.003. Epub 2011 May 10.

Deep mutational scanning: assessing protein function on a massive scale

Affiliations
Review

Deep mutational scanning: assessing protein function on a massive scale

Carlos L Araya et al. Trends Biotechnol. 2011 Sep.

Abstract

Analysis of protein mutants is an effective means to understand their function. Protein display is an approach that allows large numbers of mutants of a protein to be selected based on their activity, but only a handful with maximal activity have been traditionally identified for subsequent functional analysis. However, the recent application of high-throughput sequencing (HTS) to protein display and selection has enabled simultaneous assessment of the function of hundreds of thousands of mutants that span the activity range from high to low. Such deep mutational scanning approaches are rapid and inexpensive with the potential for broad utility. In this review, we discuss the emergence of deep mutational scanning, the challenges associated with its use and some of its exciting applications.


Figures

Figure 1
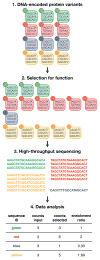
Figure 1. Deep mutational scanning to measure protein sequence-function relationships
Deep mutational scanning takes advantage of high-throughput DNA sequencing to measure the function of variants of a protein on a massive scale. A color-coded population of DNA encoded protein variants is shown (1). Each solid circle denotes a displayed protein variant linked to its encoding DNA sequence. In this idealized input library, variants have equal representation. The library is shown after selection for function of the displayed protein (2). Variants bearing beneficial mutations increase in abundance in the selected library (e.g. red and yellow) whereas deleterious variants decrease in abundance (e.g. blue). High-throughput sequencing is performed on the selected and input libraries (3). The number of times each variant is sequenced corresponds to its abundance in the library (the example shown is for the selected library). Sequencing data from the input and selected libraries are used to calculate an enrichment ratio for each variant (4). The enrichment ratio of a variant is a measure of its fitness.
Figure 2
Figure 2. Motifs, maps and landscapes for visualizing sequence-function relationships
Deep mutational scanning generates a large set of sequence-function relationships; three methods for visualizing these relationships are shown. Data for a 25 amino acid deep mutational scan of the WW domain was used to create each panel (Sequence Read Archive accession SRA020603) [24]. (a) An amino acid motif is shown. This motif illustrates the abundance of each amino acid at each position in the selected library of variants. (b) A sequence-function map is shown, which was generated by calculating the fitness effect of each amino acid at every position. In the example given, fitness corresponds to the enrichment or depletion of sequences with specific substitutions during selection. Mutations are color coded from beneficial to deleterious in a red to blue color range, respectively. Gray dots indicate substitutions with neutral fitness relative to the reference sequence. (c) A sequence-function landscape is shown. The x- and y-axes denote measures of sequence distance (i.e. points that are close to each other represent variants with similar sequences) and the z-axis illustrates fitness. The region of the landscape within a single amino acid substitution of the reference variant corresponds to the map described in (b) and is colored accordingly.

References

    1. Stenson PD, et al. The Human Gene Mutation Database: 2008 update. Genome Med. 2009;1:13. - PMC - PubMed
    1. Olivier M, et al. The clinical value of somatic TP53 gene mutations in 1,794 patients with breast cancer. Clin Cancer Res. 2006;12:1157–1167. - PubMed
    1. Ng S, et al. Targeted capture and massively parallel sequencing of 12 human exomes. Nature. 2009;461:272–276. - PMC - PubMed
    1. Pal G, et al. Comprehensive and quantitative mapping of energy landscapes for protein-protein interactions by rapid combinatorial scanning. J Biol Chem. 2006;281:22378–22385. - PubMed
    1. Matouschek A, et al. Mapping the transition state and pathway of protein folding by protein engineering. Nature. 1989;340:122–126. - PubMed

Publication types