. 2011 Jul 1;286(26):23054-62.
doi: 10.1074/jbc.M111.248831. Epub 2011 May 10.

Kinetic mechanism of human DNA ligase I reveals magnesium-dependent changes in the rate-limiting step that compromise ligation efficiency

Affiliations

Kinetic mechanism of human DNA ligase I reveals magnesium-dependent changes in the rate-limiting step that compromise ligation efficiency

Mark R Taylor et al. J Biol Chem. .

Abstract

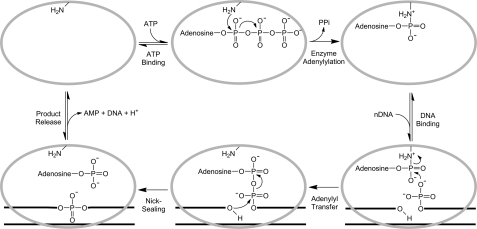
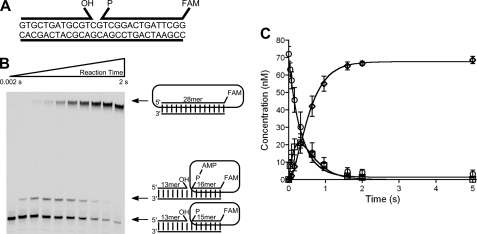
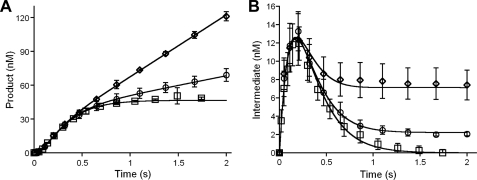
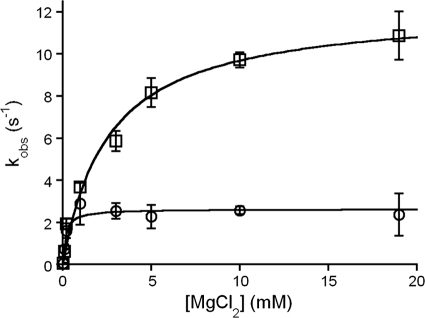
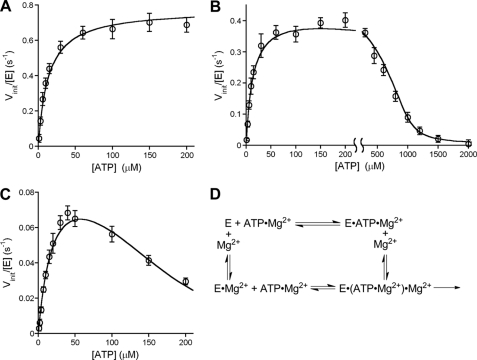
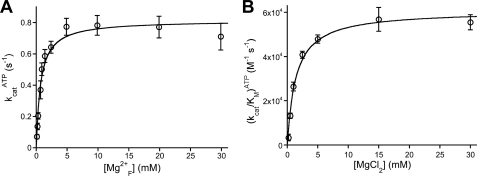
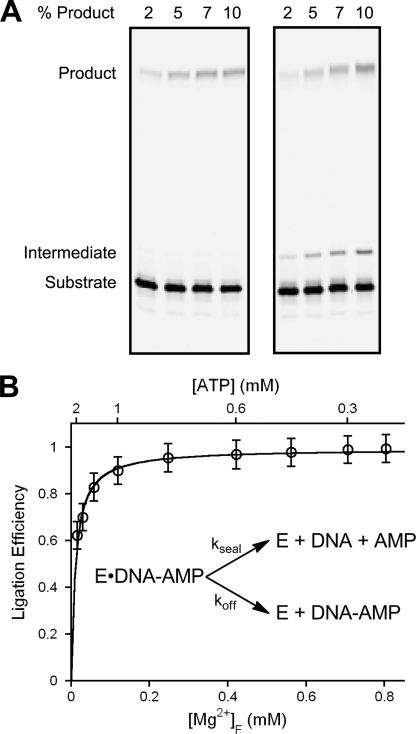
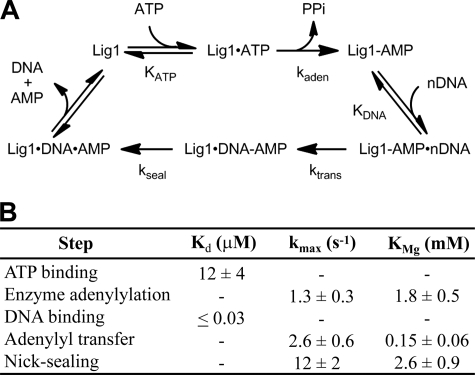
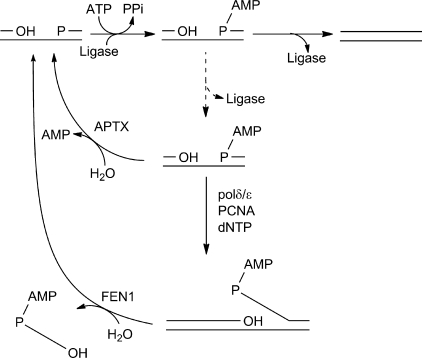
DNA ligase I (LIG1) catalyzes the ligation of single-strand breaks to complete DNA replication and repair. The energy of ATP is used to form a new phosphodiester bond in DNA via a reaction mechanism that involves three distinct chemical steps: enzyme adenylylation, adenylyl transfer to DNA, and nick sealing. We used steady state and pre-steady state kinetics to characterize the minimal mechanism for DNA ligation catalyzed by human LIG1. The ATP dependence of the reaction indicates that LIG1 requires multiple Mg(2+) ions for catalysis and that an essential Mg(2+) ion binds more tightly to ATP than to the enzyme. Further dissection of the magnesium ion dependence of individual reaction steps revealed that the affinity for Mg(2+) changes along the reaction coordinate. At saturating concentrations of ATP and Mg(2+) ions, the three chemical steps occur at similar rates, and the efficiency of ligation is high. However, under conditions of limiting Mg(2+), the nick-sealing step becomes rate-limiting, and the adenylylated DNA intermediate is prematurely released into solution. Subsequent adenylylation of enzyme prevents rebinding to the adenylylated DNA intermediate comprising an Achilles' heel of LIG1. These ligase-generated 5'-adenylylated nicks constitute persistent breaks that are a threat to genomic stability if they are not repaired. The kinetic and thermodynamic framework that we have determined for LIG1 provides a starting point for understanding the mechanism and specificity of mammalian DNA ligases.


Figures

FIGURE 1.
FIGURE 1.
Reaction pathway for ligation by a eukaryotic DNA ligase. Cleavage of the phosphoanhydride bond of ATP provides the energy required to form a phosphodiester bond in DNA. This is achieved by the initial formation of an adenylyl-lysine covalent intermediate with the release of inorganic pyrophosphate (PPi), subsequent transfer of the AMP group to the 5′-phosphate of the nDNA, and finally the attack of the 3′-hydroxyl to seal the nick and release AMP. All three of these chemical steps require Mg2+ ions (not shown).
FIGURE 2.
FIGURE 2.
Ligation assay using fluorescently labeled DNA. A, schematic of the 28-mer nicked DNA substrate. The 3′-hydroxyl (OH), 5′-phosphate (P), and 3′-fluorescein (FAM) label are shown. B, representative denaturing 20% acrylamide gel of a single-turnover ligation reaction with 80 nm nDNA, 600 nm LIG1, and 1 mm MgCl2. Shown to the right of the gel are the species represented in each band with the fluorescent molecule highlighted. C, results of quantification and fitting of substrate (○), intermediate (□), and product (♢) from three separate experiments, including the example shown in panel B. The error bars indicate one standard deviation from the mean. The lines indicate the global fit of all three species by Berkeley Madonna using the reaction mechanism from Fig. 1. The rate constants for adenylyl transfer and nick sealing are determined from these data.
FIGURE 3.
FIGURE 3.
Pre-steady state ligation reaction under burst conditions. Formation of DNA product (A) and adenylylated intermediate (B) was monitored during single- and multiple-turnover reactions containing 50 nm ligase, 500 nm nDNA, and 10 mm MgCl2 in the absence of ATP (□) or in the presence of 4 μm (○) or 150 μm ATP (♢). In reactions containing ATP, LIG1 was preincubated with ATP to allow for enzyme adenylylation. The identical burst amplitude observed for multiple-turnover and single-turnover reactions indicates that all of the active ligase is already adenylylated. At saturating ATP, the steady state rate is only slightly slower than the pre-steady state rate, and the burst is poorly defined. This demonstrates that enzyme adenylylation and adenylyl transfer occur at similar rates when the enzyme is saturated with Mg2+ ions and ATP and DNA substrates. The steady state level of adenylylated DNA intermediate is at almost 20% the level of total enzyme when ATP is saturating (150 μm, ♢), providing additional evidence that the nick-sealing step is partially rate-limiting under these conditions. The error bars indicate one standard deviation from the mean.
FIGURE 4.
FIGURE 4.
Magnesium dependence of single-turnover ligation. Reactions containing 80 nm nDNA, 600 nm LIG1, and Mg2+ concentrations that ranged from 0.02 to 19 mm were monitored by quenched flow. The time-dependent changes in the concentration of DNA product and intermediate were fit by the minimal kinetic scheme to obtain the rate constants for adenylyl transfer (○) and nick sealing (□). Both rates increase as a function of Mg2+ concentration, and the curves shown are fits to a binding hyperbola. These hyperbolic fits yield maximal rate constants of 2.6 ± 0.6 s−1 for adenylyl transfer and 12 ± 2 s−1 for nick sealing. The KMg value for the adenylyl transfer step (0.15 ± 0.06 mm) is much lower than the value observed for nick sealing (2.6 ± 0.9 mm). Due to the difference in affinity, adenylyl transfer is mostly rate-limiting at high concentrations of MgCl2, but the two steps become more closely matched at low concentrations of MgCl2. The error bars indicate one standard deviation from the mean.
FIGURE 5.
FIGURE 5.
ATP dependence of LIG1. Multiple-turnover ligation assays were performed with saturating nDNA (1 μm) and with varying concentrations of ATP and Mg2+. A, the initial rates determined with 30 mm MgCl2 are plotted as a function of ATP concentration. These data were fit by the Michaelis-Menten equation, which yields a kcat value of 0.74 ± 0.09 s−1 and a Km for ATP of 11 ± 3 μm. B, the ATP dependence with 1 mm MgCl2. The low concentrations of ATP can be fit by the Michaelis-Menten equation (not shown) to yield a kcat value of 0.4 ± 0.06 s−1 and a Km value of 13 ± 4 μm. C, the ATP dependence at 0.2 mm MgCl2. D, the kinetic model describing the requirement of LIG1 for two Mg2+ ions in the enzyme adenylylation step. The biphasic concentration dependence shown in panels B and C was fit by the model in panel D and takes into consideration the depletion of free Mg2+ due to the presence of excess ATP (see supplemental material). In panels A–C, the error bars indicate one standard deviation from the mean.
FIGURE 6.
FIGURE 6.
Magnesium dependence of multiple-turnover ligation. A, reactions contained saturating nDNA (1 μm) and ATP (100 μm), and the concentration of MgCl2 was varied (0.2–30 mm). The concentration of free Mg2+ ion was calculated using the dissociation constant for the ATP·Mg2+ complex determined from the ATP dependence fits (12 μm). Fitting of the data by a hyperbolic binding curve yields a maximal kcat value of 0.81 ± 0.1 s−1 and a value of KMg of 0.71 ± 0.2 mm. B, the values of (kcat/Km)ATP were determined with subsaturating concentrations of ATP at the indicated Mg2+ concentrations between 0.2 and 30 mm. The magnesium dependence of (kcat/Km)ATP was fit by a binding hyperbola yielding a maximal (kcat/Km)ATP value of 6.2 ± 1.1 × 10⁴ m−1s−1 and a KMg value of 1.8 ± 0.5 mm. The error bars indicate one standard deviation from the mean.
FIGURE 7.
FIGURE 7.
Evidence for the release of adenylylated intermediate during multiple-turnover ligation. A, representative gels analyzing multiple-turnover ligation with 1 mm MgCl2 and 0.2 mm (left) or 2 mm (right) ATP. Time points follow the first 10% of product formation. At low ATP concentration, no noticeable intermediate was formed (left), whereas at high ATP concentration, the intermediate accumulates in excess of enzyme concentration, indicating substantial release of intermediate (right). B, ligation efficiency as a function of free Mg2+ under conditions of stoichiometric ATP and Mg2+. Steady state rates of formation of intermediate and product were determined for reactions containing 1 mm MgCl2 and 0.2–2 mm ATP. The concentration of ATP is indicated on the upper x axis, and the calculated concentration of free Mg2+ is shown on the lower x axis. The concentration of free Mg2+ was determined using a Kd value of 12 μm for the ATP·Mg complex (Fig. 5 and supplemental Fig. S9). Data in panel B were fit by the simple partitioning scheme shown as an inset, using the independently determined values of kseal and the associated KMg for this step, allowing a Mg2+-independent value for koff of 0.05 s−1 to be determined (see supplemental material). The error bars indicate one standard deviation from the mean.
FIGURE 8.
FIGURE 8.
Minimal kinetic mechanism for LIG1. A, reaction scheme illustrating the minimal number of steps for DNA ligation. The substrate binding steps are assumed to be in rapid equilibrium, whereas the chemical steps are irreversible under the conditions employed. B, summary of individual rate and equilibrium constants at saturating Mg2+. The apparent dissociation constant for Mg2+ (KMg) was determined for individual steps of the reaction.
FIGURE 9.
FIGURE 9.
Pathways for repair of 5′-adenylylated DNA resulting from abortive ligation. Direct repair of a 5′-adenylylated nick is catalyzed by aprataxin (APTX). Alternatively, strand displacement by a replicative DNA polymerase (polδ/ϵ) generates a 5′ flap structure that can be processed by FEN1 to regenerate the adjacent 3′-hydroxyl (OH) and 5′-phosphate (P) required by DNA ligase.

Similar articles

Cited by

References

    1. Petrini J. H., Xiao Y., Weaver D. T. (1995) Mol. Cell. Biol. 15, 4303–4308 - PMC - PubMed
    1. Gao Y., Katyal S., Lee Y., Zhao J., Rehg J. E., Russell H. R., McKinnon P. J. (2011) Nature 471, 240–244 - PMC - PubMed
    1. Simsek D., Furda A., Gao Y., Artus J., Brunet E., Hadjantonakis A. K., Van Houten B., Shuman S., McKinnon P. J., Jasin M. (2011) Nature 471, 245–248 - PMC - PubMed
    1. Sekiguchi J., Ferguson D. O., Chen H. T., Yang E. M., Earle J., Frank K., Whitlow S., Gu Y., Xu Y., Nussenzweig A., Alt F. W. (2001) Proc. Natl. Acad. Sci. U.S.A. 98, 3243–3248 - PMC - PubMed
    1. Barnes D. E., Stamp G., Rosewell I., Denzel A., Lindahl T. (1998) Curr. Biol. 8, 1395–1398 - PubMed

Publication types