. 2011 Jul 15;286(28):24987-95.
doi: 10.1074/jbc.M111.242263. Epub 2011 May 11.

Characterization of G2L3 (GAS2-like 3), a new microtubule- and actin-binding protein related to spectraplakins

Affiliations

Characterization of G2L3 (GAS2-like 3), a new microtubule- and actin-binding protein related to spectraplakins

Matthew J Stroud et al. J Biol Chem. .

Abstract

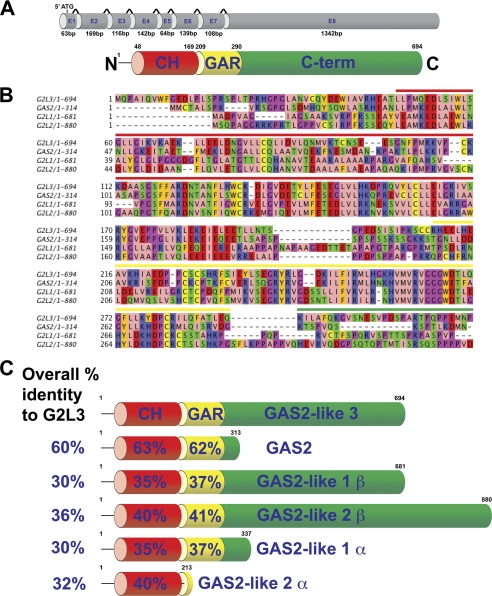
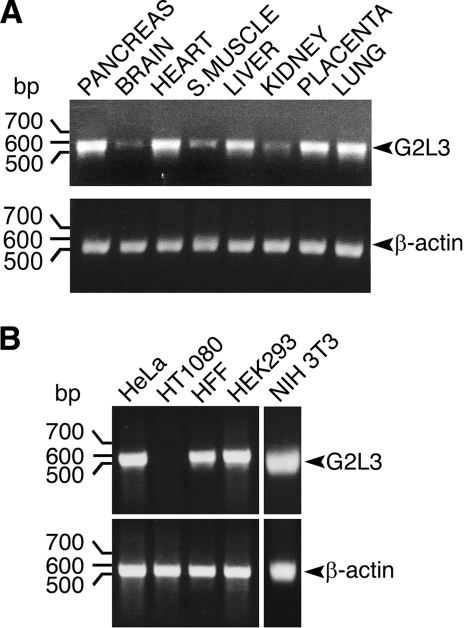
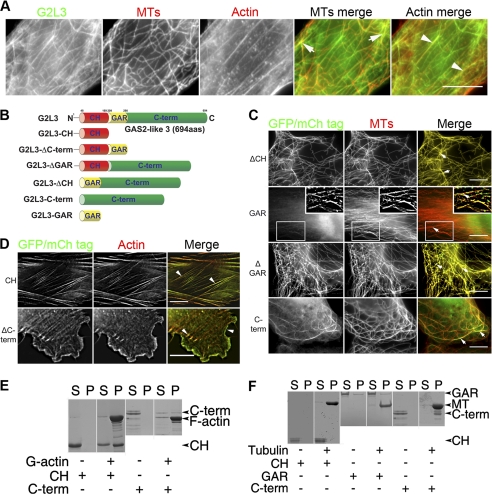
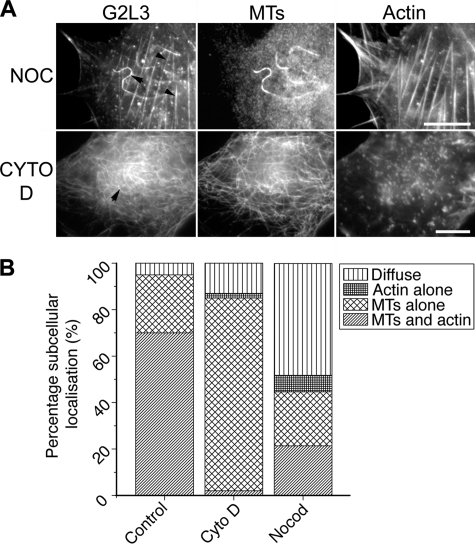
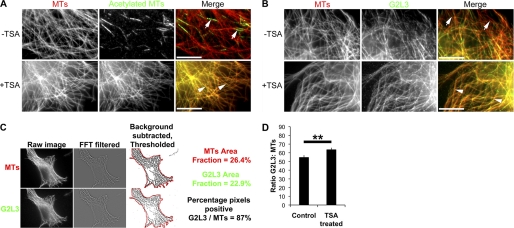
The microtubule (MT) and actin cytoskeletons are fundamental to cell integrity, because they control a host of cellular activities, including cell division, growth, polarization, and migration. Proteins involved in mediating the cross-talk between MT and actin cytoskeletons are key to many cellular processes and play important physiological roles. We identified a new member of the GAS2 family of MT-actin cross-linking proteins, named G2L3 (GAS2-like 3). We show that GAS2-like 3 is widely conserved throughout evolution and is ubiquitously expressed in human tissues. GAS2-like 3 interacts with filamentous actin and MTs via its single calponin homology type 3 domain and C terminus, respectively. Interestingly, the role of the putative MT-binding GAS2-related domain is to modulate the binding of GAS2-like 3 to both filamentous actin and MTs. This is in contrast to GAS2-related domains found in related proteins, where it functions as a MT-binding domain. Furthermore, we show that tubulin acetylation drives GAS2-like 3 localization to MTs and may provide functional insights into the role of GAS2-like 3.


Figures

FIGURE 1.
FIGURE 1.
Schematic representation of the intron-exon boundaries of the G2L3 gene and the sequence alignments of the human GAS2 protein family. A, the G2L3 gene consists of eight exons interspersed by seven introns. The CH and GAR domains are depicted in red and yellow, respectively, and the C terminus (C-term) is in green. B, sequence alignment of the GAS2 family, showing the conservation between the N termini of the GAS2 family members. The β-isoforms of G2L1 and G2L2 are shown. Note the high degree of conservation between family members. The colored bars above the alignments indicate the domain boundaries of the GAS2 family and are colored according to their domains as in A. AAs are illustrated according to their physicochemical properties using the Zappo color scheme. In brief, aliphatic or hydrophobic AAs are pink, aromatic AAs are orange, positively charged AAs are red, negatively charged AAs are green, hydrophilic AAs are blue, proline/glycine is magenta, and cysteine is yellow. C, the AA percentage identities between G2L3 and the other GAS2 family members are indicated, as well as the percentage identities between the various domains.
FIGURE 2.
FIGURE 2.
G2L3 is expressed ubiquitously in human tissues and cell lines. A, PCRs were performed on cDNA panels generated from different tissues, using primers specific for G2L3, which spanned exons 2 to 6. Primers designed specifically to recognize β-actin were used as loading controls. B, PCRs were performed using cDNA libraries generated from different cell lines. The human tissues, human cell lines (HeLa, HT1080, human foreskin fibroblast (HFF), and HEK293) and mouse cell line (NIH3T3) are indicated above each panel, the sizes of DNA are indicated on the left side of the panel in bp, and the expected PCR product sizes are indicated by arrowheads. Note the low expression of G2L3 in brain tissue and its absence in the HT1080 cell line. The data are representative of three independent experiments.
FIGURE 3.
FIGURE 3.
G2L3 binds and localizes to both microtubule and actin cytoskeletons. A, C, and D, G2L3 constructs were transiently expressed in NIH3T3 cells, followed by fixation and staining using an antibody that recognizes α-tubulin (DM1A) (41) and phalloidin to label actin. A, G2L3 localizes to both F-actin (white arrowheads) and MT cytoskeletons (white arrows). B, G2L3 constructs that were expressed as fusion constructs to GFP or mCherry (mCh) in NIH3T3 cells. C, G2L3-ΔCH (ΔCH), G2L3-ΔGAR (ΔGAR), and G2L3-C-term (C-term) all localize to MTs, and G2L3-GAR (GAR) localizes diffusely in the cytoplasm. D, G2L3-CH (CH) and G2L3-ΔC-term (ΔC-term) localize to F-actin structures. E, actin binding assays were performed using recombinant versions of G2L3-CH (CH) and G2L3-C-term (C-term), showing that the CH domain directly binds F-actin, whereas the C-term does not. F, MT-spin down assays were performed using G2L3-CH (CH) and G2L3-GAR (GAR) as well as G2L3-C-term (C-term), showing that only G2L3-C-term directly interacts with MTs in vitro. The predicted sizes of the proteins are indicated by arrowheads. Both immunofluorescence and binding assay data are representative of three independent experiments. Bars, 10 μm.
FIGURE 4.
FIGURE 4.
The individual domains of G2L3 influence the binding strength to microtubules and actin. To assess the turnover of indicated proteins in NIH3T3 cells, circular areas of 1.5-μm diameter were bleached, and recovery was measured. A, FRAP experiments performed on the actin localizing constructs. Note the slower fluorescence recovery of bleached areas in G2L3-CH (CH)-expressing cells and much faster recovery in G2L3-ΔC-term expressing cells compared with areas in G2L3-expressing cells. B, FRAP experiments performed on MT localizing constructs. Note the similar fluorescence recovery of bleached areas in cells expressing G2L3 and G2L3-ΔCH. Conversely, the fluorescence recovers faster in the bleached areas in G2L3-ΔGAR and G2L3-C-term-expressing cells. Either the prebleach (PRE) or the time in seconds is indicated in the bottom right-hand corner of each image, and the encircled areas indicate the bleach regions. C, the t½ values of recovery of the actin binding constructs are labeled in gray, and the MT-binding constructs are in black. Note that the t½ of recovery of G2L3-CH is almost double that of G2L3, and the t½ of recovery of G2L3-ΔC-term is much faster than G2L3. In accordance with B, the t½ of recovery of G2L3-ΔCH is similar to G2L3, whereas G2L3-ΔGAR and G2L3-C-term have much faster t½ values of recovery. The data represent the results from more than n = 20 bleach regions from n = 10 cells and are representative of three independent experiments. Bars, 5 μm.
FIGURE 5.
FIGURE 5.
Neither the integrity of actin nor that of microtubules is a prerequisite for G2L3 localization to microtubules or actin cytoskeletons, respectively. A, NIH3T3 cells expressing G2L3 were treated with either 10 μm nocodazole (NOC) or 2 μm cytochalasin D (CYTO D) for 30 min to determine their effects on G2L3 localization. Note that G2L3 can localize to stable MTs (top row, black arrow) and actin filaments (top row, black arrowheads) after NOC treatment, whereas G2L3 predominantly localizes to MTs (bottom row, black arrow) after treatment of cells with cytochalasin D. B, the subcellular localization of G2L3 in cells was quantified after treatment with nocodazole or cytochalasin D. Note that G2L3 localizes diffusely in a greater proportion of cells after NOC treatment, whereas G2L3 localizes to MTs in more cells after cytochalasin D (Cyto D) treatment. More than 50 cells were counted for each treatment and are representative of three independent experiments. Bars, 10 μm.
FIGURE 6.
FIGURE 6.
Post-translational acetylation of tubulin enhances G2L3 localization to microtubules. A, NIH3T3 cells were treated with TSA and were fixed and costained using antibodies directed against α-tubulin (DM1A) and acetylated α-tubulin (6–11B-1) (42). Note the low amount of acetylated tubulin in the total MT population in untreated cells (white arrows), when compared with TSA-treated cells (white arrowheads). B, NIH3T3 cells expressing G2L3 were treated with Me2SO (−TSA) or TSA (+TSA) and were fixed and stained using the DM1A antibody. Note the enhancement of G2L3 to MTs following TSA treatment (white arrowheads) compared with Me2SO-treated control cells (white arrows). C, G2L3 and MT images were passed through a FFT two-dimensional bandpass filter and background subtracted. The resulting image was thresholded to MTs, and the cell outline was drawn. Subsequently, the area fraction for G2L3 positive pixels and MTs were recorded, and the ratio between G2L3 and MTs was calculated. D, the enhancement of G2L3 to MTs was quantified as in C, to show that G2L3 localization was enhanced to MTs after treatment of TSA. More than 50 cells were counted for each condition and are representative of three independent experiments. Error bars, S.E. (p < 0.01, Student's t test). Bars, 10 μm.

References

    1. Li R., Gundersen G. G. (2008) Nat. Rev. Mol. Cell. Biol. 9, 860–873 - PubMed
    1. Goriounov D., Leung C. L., Liem R. K. (2003) J. Cell Sci. 116, 1045–1058 - PubMed
    1. Kodama A., Karakesisoglou I., Wong E., Vaezi A., Fuchs E. (2003) Cell 115, 343–354 - PubMed
    1. Wu X., Kodama A., Fuchs E. (2008) Cell 135, 137–148 - PMC - PubMed
    1. Jefferson J. J., Leung C. L., Liem R. K. (2004) Nat. Rev. Mol. Cell. Biol. 5, 542–553 - PubMed

Publication types

MeSH terms

Substances