. 2011 Jun;60(6):1759-69.
doi: 10.2337/db10-0778. Epub 2011 May 11.

Diabetes adversely affects macrophages during atherosclerotic plaque regression in mice

Affiliations

Diabetes adversely affects macrophages during atherosclerotic plaque regression in mice

Saj Parathath et al. Diabetes. 2011 Jun.

Abstract

Objective: Patients with diabetes have increased cardiovascular risk. Atherosclerosis in these patients is often associated with increased plaque macrophages and dyslipidemia. We hypothesized that diabetic atherosclerosis involves processes that impair favorable effects of lipid reduction on plaque macrophages.

Research design and methods: Reversa mice are LDL receptor-deficient mice that develop atherosclerosis. Their elevated plasma LDL levels are lowered after conditional knockout of the gene encoding microsomal triglyceride transfer protein. We examined the morphologic and molecular changes in atherosclerotic plaques in control and streptozotocin-induced diabetic Reversa mice after LDL lowering. Bone marrow-derived macrophages were also used to study changes mediated by hyperglycemia.

Results: Reversa mice were fed a western diet for 16 weeks to develop plaques (baseline). Four weeks after lipid normalization, control (nondiabetic) mice had reduced plasma cholesterol (-77%), plaque cholesterol (-53%), and plaque cells positive for macrophage marker CD68+ (-73%), but increased plaque collagen (+116%) compared with baseline mice. Diabetic mice had similarly reduced plasma cholesterol, but collagen content increased by only 34% compared with baseline; compared with control mice, there were lower reductions in plaque cholesterol (-30%) and CD68+ cells (-41%). Diabetic (vs. control) plaque CD68+ cells also exhibited more oxidant stress and inflammatory gene expression and less polarization toward the anti-inflammatory M2 macrophage state. Many of the findings in vivo were recapitulated by hyperglycemia in mouse bone marrow-derived macrophages.

Conclusions: Diabetes hindered plaque regression in atherosclerotic mice (based on CD68+ plaque content) and favorable changes in plaque macrophage characteristics after the reduction of elevated plasma LDL.


Figures
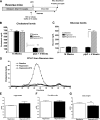
FIG. 1.
FIG. 1.
Experimental design and plasma lipid and glucose data. A: Reversa mice were placed on a western diet for 16 weeks. A group of animals (n = 10) was killed at 16 weeks of western diet and used as the baseline group. Two other groups of animals (n = 10 each) received citrate buffer or STZ at 15 weeks. At 16 weeks, regression and regression/STZ groups received pIpC injections and were switched to a chow diet. Animals were killed 4 weeks after the last pIpC injection. Plasma cholesterol (B) and glucose levels (C) were measured at the 16-week time point and at the end of the experiment. D: Plasma samples were also analyzed by fast protein liquid chromatography (FPLC) using pooled plasma from five animals. Total cholesterol was measured in each fraction. Plasma triglycerides (E), nonesterified free fatty acids (F), and body weight (G) were also measured at the end of the experiment. Data (mean ± SEM) were analyzed using one-way ANOVA followed by Bonferroni’s multiple comparison test (B) or Student two-tailed t test (C and G). P < 0.05 values were considered to be significant, **P < 0.01 and ***P < 0.001.
FIG. 2.
FIG. 2.
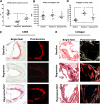
Diabetic mice have increased CD68+ cell and decreased collagen content compared with nondiabetic mice after plasma lipid reduction. Aortic roots from baseline and the two regression groups were sectioned, fixed, and stained for CD68+ cells. A: CD68+ cells as the percentage of plaque area. B: Plaque areas quantified by Image Pro Plus software. C: Sample pictures of CD68 staining are shown for each group. D: Collagen content was determined by picrosirius red staining using both bright field and polarized light microscopy and quantified by Image Pro Plus software. Data are presented as the percentage of lesion area. E: Representative sample pictures of collagen staining are shown for each group. Each group contains 8–10 animals. Data (means ± SEM) were analyzed using one-way ANOVA followed by Bonferroni’s multiple comparison test. P values are shown as *P < 0.05 and ***P < 0.001. (A high-quality digital representation of this figure is available in the online issue.)
FIG. 3.
FIG. 3.
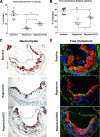
Effects of diabetes on the lipid content of aortic root sections after plasma lipid reduction. Aortic roots were sectioned, fixed, and stained for neutral lipids (presumably cholesteryl esters) using Oil-Red O or for free cholesterol using filipin. The stained areas were quantified by Image Pro Plus software. Oil-Red O–positive areas (A) and free cholesterol (blue staining) (B) are quantified and presented as the percentage of total plaque area. Sample pictures of each lipid stain are shown for all experimental groups in C and D. In addition to filipin staining, immunostaining for CD68 (red) and β-actin (green) are also shown (D). Data (means ± SEM) were analyzed using one-way ANOVA followed by Bonferroni’s multiple comparison test. P < 0.05 values were considered to be significant, *P < 0.05 and ***P < 0.001. (A high-quality digital representation of this figure is available in the online issue.)
FIG. 4.
FIG. 4.
Hyperglycemia blunts macrophage polarization in vitro by IL-4. For each experiment, BMDMs were pooled from two to three Reversa animals and differentiated into M0 (unactivated) macrophages. The cells were then treated with or without IL-4 (to induce M2 polarization) in normal d+l-glucose (100 mg/dL d-glucose + 350 mg/dL l-glucose) or high d-glucose (450 mg/dL) for 24 h. RT-PCR was performed, and 28S mRNA was used as a normalizing variable. Results shown are for arginase 1 (A) and Fizz (B). C: Arginase functional activity was measured by urea production according to the manufacturer’s protocol (QuantiChrom; BioAssay Systems, Hayward, CA). D: Collagen content of cultured BMDM treated with IL-4 (10 ng/mL) for 48 h in normal or high glucose was determined by picosirius red staining and quantified using polarized light microscopy. Stained areas were quantified by Image Pro Plus software. Data (means ± SEM) were analyzed using one-way ANOVA followed by Bonferroni’s multiple comparison test (A and B) or Student two-tailed t test (C and D). *P < 0.05 and ***P < 0.001 values were considered to be significant. (A high-quality color representation of this figure is available in the online issue.)
FIG. 5.
FIG. 5.
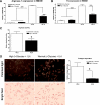
Hyperglycemia increased oxidative stress in vivo and in vitro, and altered macrophage morphology and cell spreading in vitro. A: Frozen aortic root sections from baseline, regression, and STZ/regression mice were stained with dihydroethidium to assess oxidative stress. The area stained was quantified by Image Pro Plus software, and representative images from the regression and regression/STZ groups are shown. B: BMDMs were incubated with DMEM containing normal d+l-glucose (100 mg/dL d-glucose + 350 mg/dL l-glucose) or high d-glucose (450 mg/dL) for 24 h. Cellular oxidative stress was determined by staining suspended cells with MitoSOX (Molecular Probes). The cells were then subjected to fluorescence-activated cell sorter analysis (red = normal d-glucose and blue = high d-glucose) or replated on chamber slides and the staining quantified using Image Pro Plus. C: BMDMs were also stained with tubulin, and the length and width were measured with Image Pro Plus software. D: For spreading experiments, cells were treated as above and replated on collagen-coated slides for 2 h and then stained with FITC-phalloidin following the manufacturer’s protocol (Invitrogen). Cell areas were determined using Image Pro Plus. Data (means ± SEM) were analyzed using one-way ANOVA followed by Bonferroni’s multiple comparison test (A) or Student two-tailed t test (B–D). *P < 0.05 and ***P < 0.001 values were considered to be significant. (A high-quality digital representation of this figure is available in the online issue.)

References

    1. Haffner SM, Lehto S, Rönnemaa T, Pyörälä K, Laakso M. Mortality from coronary heart disease in subjects with type 2 diabetes and in nondiabetic subjects with and without prior myocardial infarction. N Engl J Med 1998;339:229–234 - PubMed
    1. Karlson BW, Herlitz J, Hjalmarson A. Prognosis of acute myocardial infarction in diabetic and non-diabetic patients. Diabet Med 1993;10:449–454 - PubMed
    1. Burke AP, Kolodgie FD, Zieske A, et al. Morphologic findings of coronary atherosclerotic plaques in diabetics: a postmortem study. Arterioscler Thromb Vasc Biol 2004;24:1266–1271 - PubMed
    1. Timmins JM, Lee J-Y, Boudyguina E, et al. Targeted inactivation of hepatic Abca1 causes profound hypoalphalipoproteinemia and kidney hypercatabolism of apoA-I. J Clin Invest 2005;115:1333–1342 - PMC - PubMed
    1. Ross R. Atherosclerosis is an inflammatory disease. Am Heart J 1999;138:S419–S420 - PubMed

Publication types

MeSH terms