

Postprandial and fasting hepatic glucose fluxes in long-standing type 1 diabetes
- PMID: 21562079
- PMCID: PMC3114392
- DOI: 10.2337/db10-1001
Postprandial and fasting hepatic glucose fluxes in long-standing type 1 diabetes
Abstract
Objective: Intravenous insulin infusion partly improves liver glucose fluxes in type 1 diabetes (T1D). This study tests the hypothesis that continuous subcutaneous insulin infusion (CSII) normalizes hepatic glycogen metabolism.
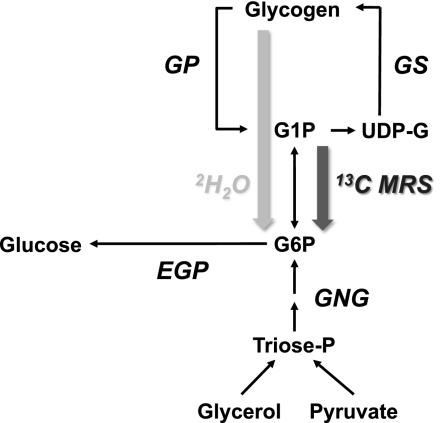
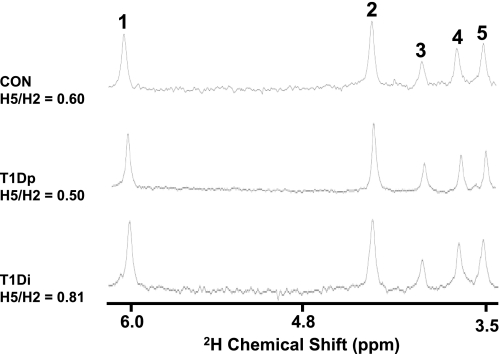
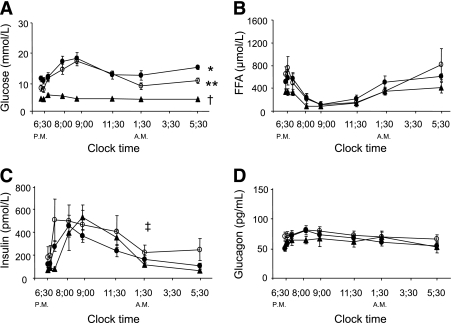
Research design and methods: T1D with poor glycemic control (T1Dp; HbA(1c): 8.5 ± 0.4%), T1D with improved glycemic control on CSII (T1Di; 7.0 ± 0.3%), and healthy humans (control subjects [CON]; 5.2 ± 0.4%) were studied. Net hepatic glycogen synthesis and glycogenolysis were measured with in vivo (13)C magnetic resonance spectroscopy. Endogenous glucose production (EGP) and gluconeogenesis (GNG) were assessed with [6,6-(2)H(2)]glucose, glycogen phosphorylase (GP) flux, and gluconeogenic fluxes with (2)H(2)O/paracetamol.
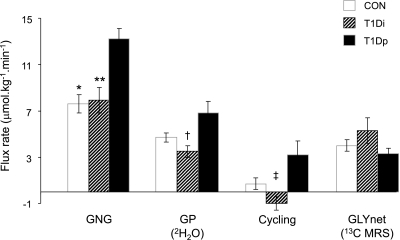
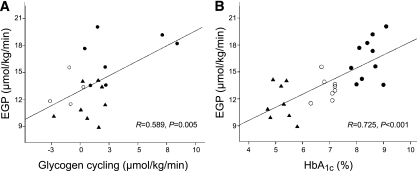
Results: When compared with CON, net glycogen synthesis was 70% lower in T1Dp (P = 0.038) but not different in T1Di. During fasting, T1Dp had 25 and 42% higher EGP than T1Di (P = 0.004) and CON (P < 0.001; T1Di vs. CON: P = NS). GNG was 74 and 67% higher in T1Dp than in T1Di (P = 0.002) and CON (P = 0.001). In T1Dp, GP flux (7.0 ± 1.6 μmol ⋅ kg(-1) ⋅ min(-1)) was twofold higher than net glycogenolysis, but comparable in T1Di and CON (3.7 ± 0.8 and 4.9 ± 1.0 μmol ⋅ kg(-1) ⋅ min(-1)). Thus T1Dp exhibited glycogen cycling (3.5 ± 2.0 μmol ⋅ kg(-1) ⋅ min(-1)), which accounted for 47% of GP flux.
Conclusions: Poorly controlled T1D not only exhibits augmented fasting gluconeogenesis but also increased glycogen cycling. Intensified subcutaneous insulin treatment restores these abnormalities, indicating that hepatic glucose metabolism is not irreversibly altered even in long-standing T1D.
Figures
References
-
- Magnusson I, Rothman DL, Gerard DP, Katz LD, Shulman GI. Contribution of hepatic glycogenolysis to glucose production in humans in response to a physiological increase in plasma glucagon concentration. Diabetes 1995;44:185–189 - PubMed
-
- Bischof MG, Krssak M, Krebs M, et al. Effects of short-term improvement of insulin treatment and glycemia on hepatic glycogen metabolism in type 1 diabetes. Diabetes 2001;50:392–398 - PubMed
-
- Kishore P, Gabriely I, Cui MH, et al. Role of hepatic glycogen breakdown in defective counterregulation of hypoglycemia in intensively treated type 1 diabetes. Diabetes 2006;55:659–666 - PubMed
Publication types
MeSH terms
Substances
LinkOut - more resources
Full Text Sources
Medical
Miscellaneous
