

Measurement of protein unfolding/refolding kinetics and structural characterization of hidden intermediates by NMR relaxation dispersion
- PMID: 21562212
- PMCID: PMC3107309
- DOI: 10.1073/pnas.1105682108
Measurement of protein unfolding/refolding kinetics and structural characterization of hidden intermediates by NMR relaxation dispersion
Abstract
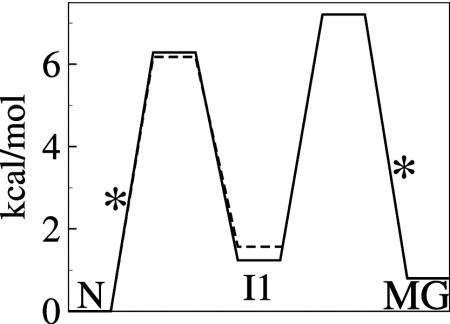
Detailed understanding of protein function and malfunction hinges on the ability to characterize transiently populated states and the transitions between them. Here, we use (15)N, , and (13)CO NMR R(2) relaxation dispersion to investigate spontaneous unfolding and refolding events of native apomyoglobin. Above pH 5.0, dispersion is dominated by processes involving fluctuations of the F-helix region, which is invisible in NMR spectra. Measurements of R(2) dispersion for residues contacted by the F-helix region in the native (N) structure reveal a transient state formed by local unfolding of helix F and undocking from the protein core. A similar state was detected at pH 4.75-4.95 and determined to be an on-pathway intermediate (I1) in a linear three-state unfolding scheme (N&lrarr2;I1&lrarr2;MG) leading to a transiently populated molten globule (MG) state. The slowest steps in unfolding and refolding are N → I1 (36 s(-1)) and MG → I1 (26 s(-1)), respectively. Differences in chemical shift between N and I1 are very small, except in regions adjacent to helix F, showing that their core structures are similar. Chemical shift changes between the N and MG states, obtained from R(2) dispersion, reveal that the transient MG state is structurally similar to the equilibrium MG observed previously at high temperature and low pH. Analysis of MG state chemical shifts shows the location of residual helical structure in the transient intermediate and identifies regions that unfold or rearrange into nonnative structure during the N → MG transition. The experiments also identify regions of energetic frustration that "crack" during unfolding and impede the refolding process.
Conflict of interest statement
The authors declare no conflict of interest.
Figures
 , 15N, 13CO,
  , and
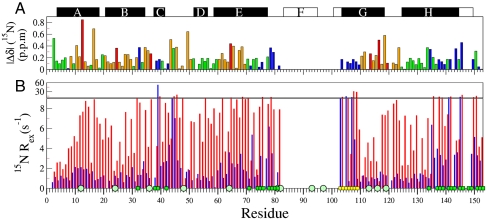
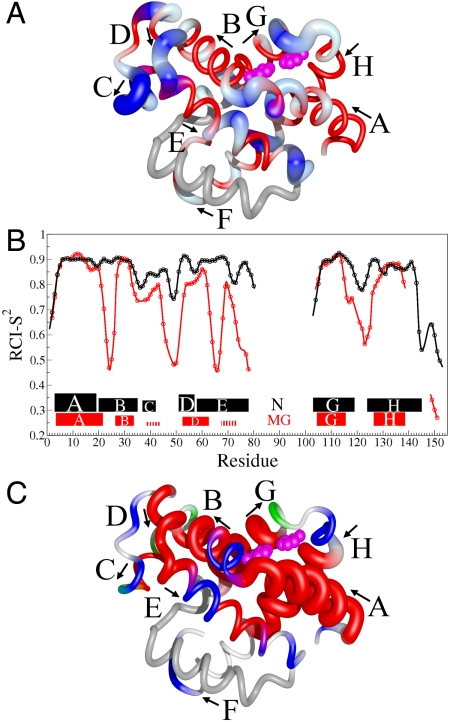
, and  chemical shifts (6), whereas the boundaries of the F, G, and H helices in holoMb are shown as open rectangles. (B) 15N Rex (at a static magnetic field of 11.7 T) of deuterated apoMb at 35 °C; pH 5.9 (blue), pH 4.9 (red). Rex was estimated from the difference in R2eff at the lowest and highest 1/τcp values. The green squares on the horizontal axis indicate contact sites with helix F in holoMb, and the circles identify His residues. Yellow squares indicate the N-terminal region of helix G.
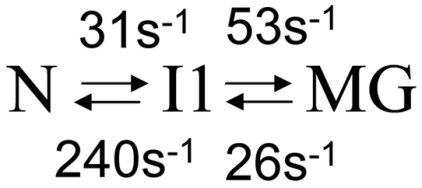
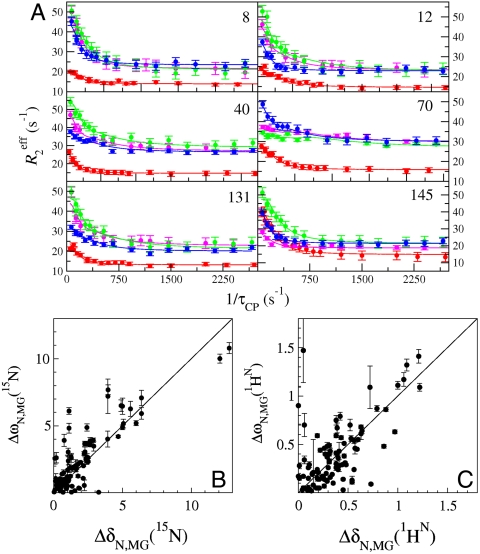
 (C) equilibrium chemical shift differences (ppm) between the N (pH 4.95) and MG (pH 4.1) states, |ΔδN,MG|, and the chemical shift differences |ΔωN,MG| obtained from a global fit of the dispersion curves to the linear model N⇆I1⇆MG. A line of slope 1 is shown as a visual guide. Some scatter in the correlation plots for amide 15N and
  resonances is to be expected because of unavoidable differences in sample conditions, required to obtain spectra of the equilibrium MG (pH 4.1, 50 °C, 10% ethanol) (8).
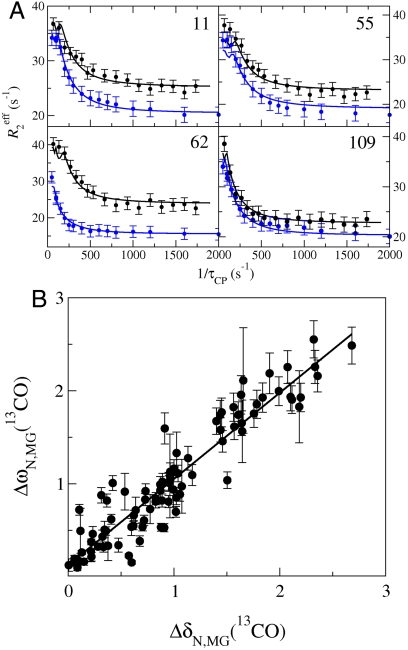
 , 15N, and 13CO chemical shifts (derived from ΔωN,MG as described in
  , 15N, 13CO,
  ,
,  shifts) was available for the N state; however, the helical boundaries and RCI-S2 for N were not significantly altered when predicted from a limited set of
  , 15N, 13CO shifts. The rectangles depict the location of helical structure in each state; the thickness of each rectangle is proportional to the population of helix. The hatched lines indicate the small population of transient helical structure in the C- and E-helix regions of MG. (C) Changes in secondary structure accompanying the N⇆MG transition, mapped to the structure of holoMb. Residues predicted to be helical by TALOS+ are red. The population of helix in the MG ensemble is indicated by the tube radius, with a larger radius indicating higher population. Flexible regions with RCI S2 < 0.7 are blue, and coil regions with S2 > 0.7 are green. A white backbone trace indicates regions for which no predictions are available. The His24 and His119 side chains are shown as pink spheres in A and C. The figure was prepared using the program MolMol (36) from the coordinates of holoMb (Protein Data Bank ID code 1MBC).
References
-
- Powers ET, Morimoto RI, Dillin A, Kelly JW, Balch WE. Biological and chemical approaches to diseases of proteostasis deficiency. Annu Rev Biochem. 2009;78:959–991. - PubMed
-
- Dobson CM. Protein folding and misfolding. Nature. 2003;426:884–890. - PubMed
-
- Loria JP, Rance M, Palmer AG. A relaxation-compensated Carr–Purcell–Meiboom–Gill sequence for characterizing chemical exchange by NMR spectroscopy. J Am Chem Soc. 1999;121:2331–2332.
-
- Tollinger M, Skrynnikov NR, Mulder FA, Forman-Kay JD, Kay LE. Slow dynamics in folded and unfolded states of an SH3 domain. J Am Chem Soc. 2001;123:11341–11352. - PubMed
-
- Sugase K, Dyson HJ, Wright PE. Mechanism of coupled folding and binding of an intrinsically disordered protein. Nature. 2007;447:1021–1025. - PubMed
Publication types
MeSH terms
Substances
Grants and funding
LinkOut - more resources
Full Text Sources
