. 2011 May 11;31(19):6982-96.
doi: 10.1523/JNEUROSCI.6150-10.2011.

Same or different? A neural circuit mechanism of similarity-based pattern match decision making

Affiliations

Same or different? A neural circuit mechanism of similarity-based pattern match decision making

Tatiana A Engel et al. J Neurosci. .

Abstract

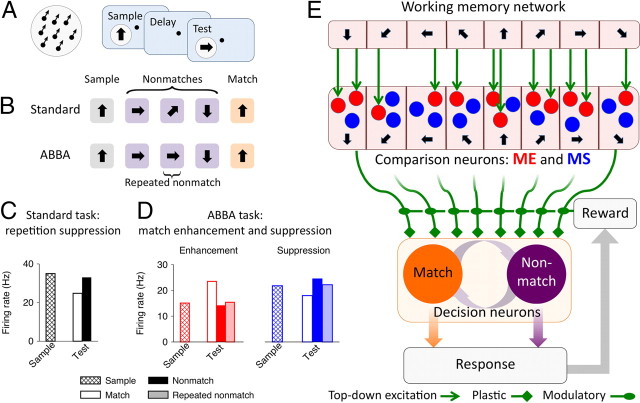
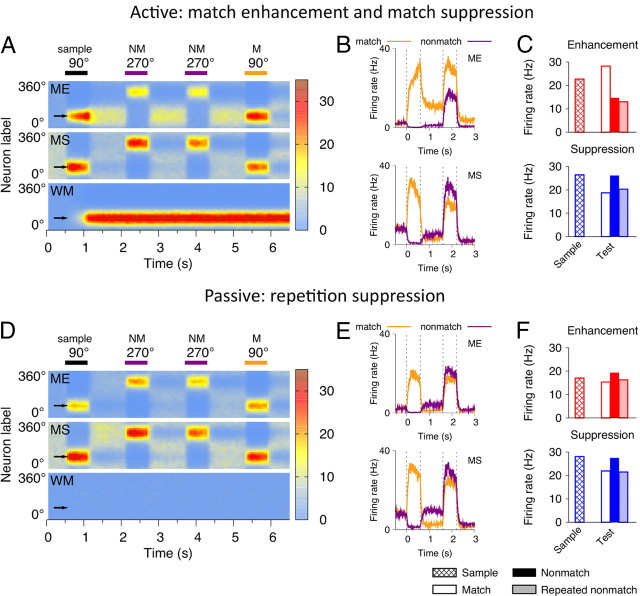
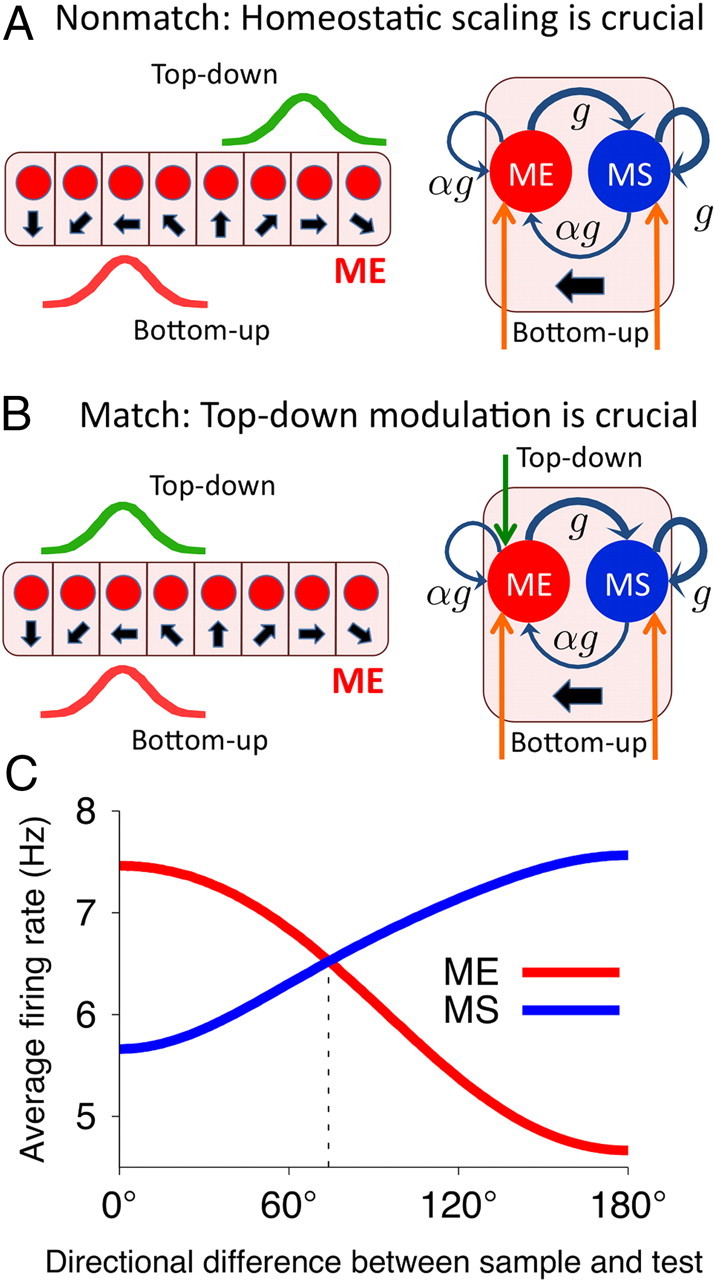
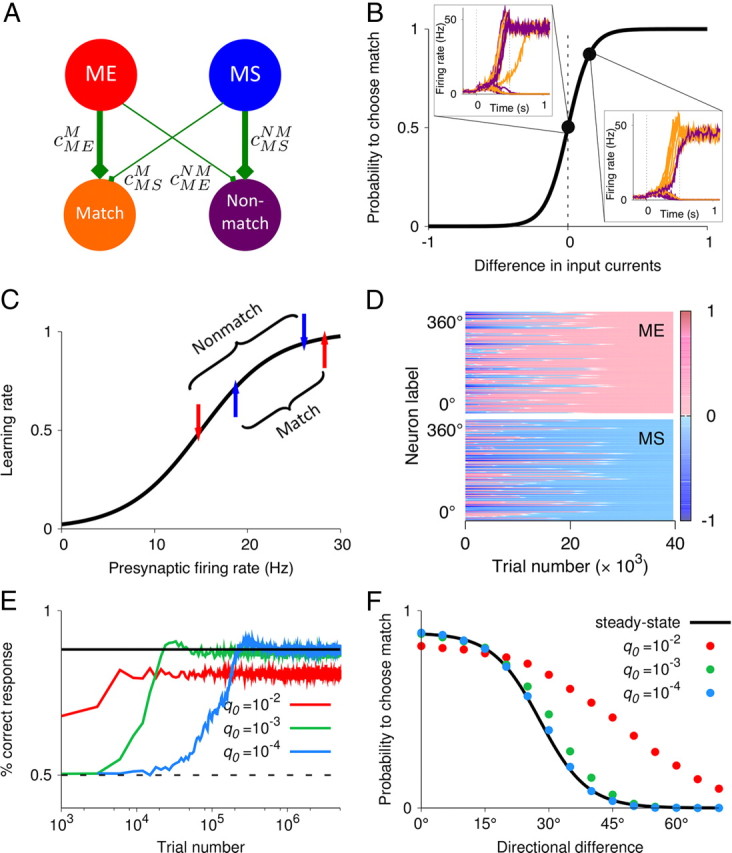
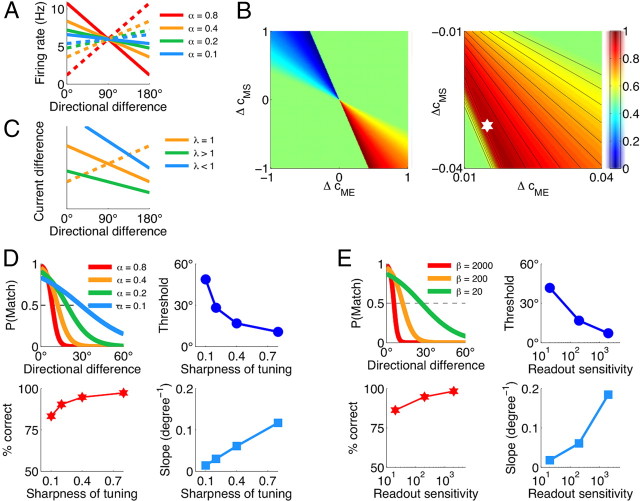
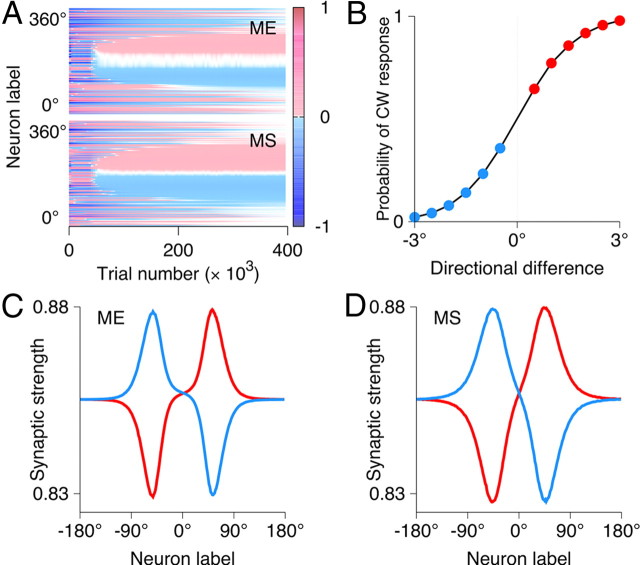
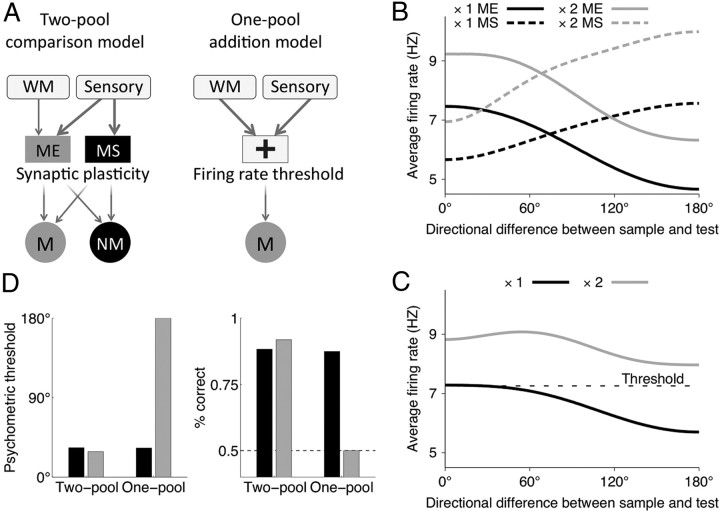
The ability to judge whether sensory stimuli match an internally represented pattern is central to many brain functions. To elucidate the underlying mechanism, we developed a neural circuit model for match/nonmatch decision making. At the core of this model is a "comparison circuit" consisting of two distinct neural populations: match enhancement cells show higher firing response for a match than a nonmatch to the target pattern, and match suppression cells exhibit the opposite trend. We propose that these two neural pools emerge from inhibition-dominated recurrent dynamics and heterogeneous top-down excitation from a working memory circuit. A downstream system learns, through plastic synapses, to extract the necessary information to make match/nonmatch decisions. The model accounts for key physiological observations from behaving monkeys in delayed match-to-sample experiments, including tasks that require more than simple feature match (e.g., when BB in ABBA sequence must be ignored). A testable prediction is that magnitudes of match enhancement and suppression neural signals are parametrically tuned to the similarity between compared patterns. Furthermore, the same neural signals from the comparison circuit can be used differently in the decision process for different stimulus statistics or tasks; reward-dependent synaptic plasticity enables decision neurons to flexibly adjust the readout scheme to task demands, whereby the most informative neural signals have the highest impact on the decision.


Figures

Figure 1.
Figure 1.
Delayed match-to-sample task, neural encoding of match/nonmatch, and schematic of the circuit model. A, Left, Random dot stimulus. Right, The DMS task. The sample stimulus is followed by a sequence of test stimuli separated by delays. A behavioral response is required if the test matches the sample. B, Example trials in two versions of the DMS task. In the standard task, all intervening nonmatches are different, and the match is the only perceptual stimulus repetition within a trial. In the ABBA task, irrelevant repetitions of nonmatches should be ignored. C, Repetition suppression in inferior temporal cortex neurons in the standard DMS task [data from Miller et al. (1993)]. Average responses across cells to the same set of stimuli appearing as a sample, match, and nonmatch. D, Match enhancement and match suppression in two complementary populations of prefrontal cortex neurons in the ABBA task [data from Miller et al. (1996)]. Average responses across cells to the same set of stimuli appearing as a sample, match, nonmatch, and repeated nonmatch. E, Schematic of the circuit model. Neurons in the WM and comparison networks (ME and MS subpopulations) are tuned to directions of motion (indicated by arrows) and receive directional bottom–up input. Top–down projections from the WM to the comparison network are heterogeneous. ME neurons (red circles) receive stronger top–down excitation than MS neurons (blue circles). The decision network (match and nonmatch subpopulations) generates categorical match versus nonmatch choices by pooling activities of the ME and MS neurons through synapses that undergo reward-dependent Hebbian plasticity.
Figure 2.
Figure 2.
Active and passive memory mechanisms in the circuit model: active match enhancement and suppression (A–C), passive repetition suppression (D–F). A, D, Spatiotemporal activity pattern in the WM, ME, and MS populations in an ABBA task, where a sample (90°) is followed by two nonmatch test stimuli (270°) and then by the final match (90°). x-axis, Time; y-axis, neurons labeled by their preferred directions; firing rate is color-coded. A, Comparison neurons respond to their preferred stimuli, but the activity is higher in the ME cells than in the MS cells for the match, and vice versa for the nonmatch stimuli. D, If the activity in the WM circuit is disrupted, passive repetition suppression prevails in the comparison neurons. B, E, Firing rates of a neuron preferring the test stimulus on two trials: when the test appears as a match (orange line) and as a nonmatch (purple line). In the match condition, the sample is also the preferred stimulus for this neuron, and in the nonmatch condition the sample is the antipreferred stimulus. Note sample-selective persistent activity in the ME cell during the delay. C, F, Average responses to the preferred stimulus of the neuron appearing as a sample, match, nonmatch, and repeated nonmatch. These model results account for the single-neuron activities recorded from behaving monkeys in Figure 1, C and D.
Figure 3.
Figure 3.
Circuit mechanism of match enhancement and suppression and neural tuning to the sample-test similarity. A, B, Left, Configuration of the top–down (green) and bottom–up (red) inputs to the ME population in the nonmatch (A) and match (B) conditions. Right, A column with the ME and MS neurons preferring the test stimulus is drawn. A, Nonmatch condition, The MS neuron has higher activity because of stronger recurrent excitation (thick blue arrows). B, Match condition, Top–down input compensates for weaker recurrent excitation, and the ME neuron has higher activity. C, Similarity tuning. Average population firing rate for the ME (red line) and MS (blue line) neurons as a function of directional difference between the sample and test. The ME and MS populations are parametrically tuned to the sample-test similarity in complementary ways.
Figure 4.
Figure 4.
Learning the DMS task through reward-dependent Hebbian plasticity. A, Schematic of synaptic connections between the comparison (ME and MS) and the decision (match and nonmatch) populations. Through synaptic plasticity, a connectivity profile emerges such that the ME and MS neurons preferentially target match and nonmatch populations, respectively (i.e., ΔcME = cMEMcMENM > 0 and ΔcMS = cMSMcMSNM < 0). B, In the decision circuit, the trial-averaged performance is captured by the sigmoidal dependence of probability to choose match on the difference in synaptic input currents to the match and nonmatch populations, ΔI = gΣicMErME + ΔcMSrMS]. Firing rates of the match (orange) and nonmatch (purple) populations in 10 simulated trials are shown in two cases: for ΔI = 0 when match and nonmatch are chosen equally often; for ΔI > 0 when match is chosen more frequently than nonmatch. C, Learning rate is a monotonically increasing function of the presynaptic firing rate. The arrows indicate the firing rates of a ME (red) and MS (blue) neuron in response to their preferred stimulus appearing as match and as nonmatch (0° and 180° directional difference, respectively). D, Spatiotemporal dynamics of the synaptic strengths. Differences of the synaptic strengths ΔcME and ΔcMS are color coded for all comparison neurons. x-axis, Trial number; y-axis, presynaptic neurons labeled by their preferred directions. E, In the learning process, the fraction of correctly performed trials increases faster for higher learning rates q0. Solid black line, Steady-state performance; dashed line, chance level. F, Psychometric function obtained from the steady-state calculations (black line) and from simulations with different q0 (colored circles). The performance approaches the steady-state level for sufficiently low q0. Stimulus statistics is the same as in Figure 7 for p0 = 0.5.
Figure 5.
Figure 5.
The behavioral performance of the model is jointly determined by the firing rates of the ME and MS neurons, sensitivity of the decision circuit, and the profile of synaptic connections between the comparison and decision circuits. For this simplified analysis, we assumed linear similarity tuning in the ME and MS populations as well as linear dependence of the learning rate q(r) on the firing rate. Specifically, we used the functions fME,MS(x) = ±αx + 0.5(1 ∓ α), where the upper and lower signs refer to the ME and MS populations, respectively. For different directional differences θi, the firing rates followed: rME,MSi/180°) = 12 Hz · fME,MS(x), and the learning rates were just qME,MSi/180°) = fME,MS(x). A, The parameter α determines the sharpness of similarity tuning in the ME (solid lines) and MS (dashed lines) populations, whereby larger α corresponds to larger difference between the activities of the ME and MS populations. B, The overall performance of the model (fraction of correct responses) color coded as a function of synaptic differences ΔcME and ΔcMS. Right panel, Zoom into the region of small Δc. The white star indicates the steady-state Δc obtained through learning. α = 0.4 and β = 200 nA−1 are fixed. C, Two contributions to the difference in postsynaptic currents, |ΔIME| (solid lines) and |ΔIMS| (dashed line) for different values of λ = |ΔcMScME|. The crossing point of these two curves and hence the psychometric threshold shift to larger directional differences for λ < 1, and to smaller directional differences for λ > 1. α = 0.4. D, Dependence of the psychometric function on the sharpness of similarity tuning in the comparison network. Sharper tuning (corresponds to larger values of α) results in lower psychometric threshold, larger slope of the psychometric function, and better overall performance. β = 200 nA−1 is fixed. E, Dependence of the psychometric function on the sensitivity of the decision network. Higher sensitivity (corresponds to larger values of β) results in lower psychometric threshold, larger slope of the psychometric function, and better overall performance. α = 0.4 is fixed. The synaptic strengths in D and E are adjusted through learning. Stimulus statistics is the same as in Figure 7 for p0 = 0.5.
Figure 6.
Figure 6.
Degradation of performance in the DMS task with memory delay. A, Memory of the sample is encoded by the peak location of the bell-shaped persistent activity pattern in the WM circuit (see Materials and Methods). Variance of the remembered sample growths linearly with time, consistent with a diffusion process. The insets show the probability density for the remembered sample after 1 s (orange) and 10 s (blue) delays (gray histogram, simulations; solid color line, Gaussian fit). B, Example traces for the peak location of the persistent activity pattern in the WM circuit, which represents the sample memory during the delay. C, Psychometric function in the DMS task for different durations of the memory delay. D, Psychometric threshold increases and the slope of the psychometric function decreases for longer delays. The overall performance decreases for longer delays but remains at relatively high level for all delays. Relative discrimination (ratio of the threshold at 0.2 s delay to the threshold at longer delays) decreases with the delay duration, which accounts for the psychophysical observations with monkeys (Pasternak and Greenlee, 2005). Stimulus statistics is the same as in Figure 7 for p0 = 0.5.
Figure 7.
Figure 7.
Plastic synapses encode priors for match and nonmatch and act to optimize performance. A, Schematic of the stimulus statistics in the DMS task with different priors for match. Sample motion direction is drawn from a uniform distribution on [0°, 360°]. Match (red arrow) corresponds to zero directional difference. Nonmatches (blue arrows) differ from the sample by Δθ = {±5°, ±10° … ±180°}, which are all equally probable. Note that the smallest nonmatch directional difference is ±5°, which sets the tolerance level. Match and nonmatch trials are randomly interleaved. Prior probability for a match trial is p0 (indicated by the thickness of the red arrow). B, Performance of the network model for different match priors p0 (colored lines labeled by p0 values). C, Performance of the ideal Bayesian observer for different match priors p0. In both cases (B, C), the psychometric function changes toward higher probability to choose match as p0 increases, which reflects the trade-off involved in fine discrimination between the match and nonmatch stimuli that are similar to the sample. D–G, Psychometric threshold (D), slope of the psychometric function (E), probability to correctly identify match (F), and the overall performance (G) for the network model (colored symbols) and for the ideal Bayesian observer (gray symbols) as functions of the match prior p0. Although changes in the psychometric function of the network model differ quantitatively from the Bayesian strategy, the overall performance of the network is virtually the same as for the ideal Bayesian observer.
Figure 8.
Figure 8.
Range of sample test similarities affects performance on the DMS task. A, Schematic of stimulus statistics with different ranges of sample-test similarities. Nonmatches differ from the sample by Δθ = {±5°, ±10° … ±ψ}, which are all equally probable, and ψ is the range of directional differences. Prior probability for a match trial is fixed at p0 = 0.5. B, As the range ψ decreases, the number of erroneous match decisions for small Δθ ≠ 0° decreases, but the number of correct match decisions for Δθ = 0° also decreases. C, Probabilities to correctly identify a match (Δθ = 0°) and a nonmatch that is similar (|Δθ| = 5°–20°) and dissimilar (|Δθ| = 25°–180°) to the sample are plotted for five ψ values. The probability to correctly identify dissimilar, easily discernible nonmatch (green diamond) is always high. As the range ψ decreases, the probability to correctly identify very similar nonmatch (purple square) increases along with its prior probability (gray bar), whereas the probability to correctly identify match (orange circle) decreases. D, Overall performance decreases as the range of directional differences becomes very narrow.
Figure 9.
Figure 9.
Synaptic plasticity adjusts the readout scheme according to task demands, illustrated by simulations of a fine motion discrimination (Purushothaman and Bradley, 2005). Sample moves in the fixed reference direction. Test stimuli are inclined by Δθ = {±0.5°, ±1° … ±3°} relative to the reference direction. The task is to judge whether a test stimulus is inclined clockwise (Δθ > 0) or counterclockwise (Δθ < 0) relative to the reference. After learning, the choice-selective populations in the decision circuit encode clockwise/counterclockwise (instead of match/nonmatch) decisions and hence are labeled as CW and CCW. A, Spatiotemporal dynamics of the synaptic strengths. Differences of the synaptic strengths Δc = cCWcCCW are color coded for comparison neurons with all preferred directions. x-axis, Trial number; y-axis, presynaptic neurons labeled by their preferred directions. Through learning, a connectivity profile emerges, such that neurons tuned clockwise and counterclockwise relative to the reference preferentially target the CW- and CCW-selective populations, respectively. B, Psychometric function for the fine motion discrimination. Psychometric threshold is ∼1°–2°. C, D, Strengths of synaptic connections to the CW-selective (red; cMECW and cMSCW) and CCW-selective (blue; cMECCW and cMSCCW) populations after learning. Activity of each neuron is gradually weighted in the decision process, whereby higher weights are assigned to the most sensitive neurons tuned 40°–70° away from the reference direction.
Figure 10.
Figure 10.
Behavioral performance in the two-pool comparison model, but not in the one-pool addition model, is robust to changes in the sensory input strength. A, Schematics of the two-pool comparison model (simplified version of Fig. 1E) and of the one-pool addition model (for details, see Materials and Methods). B, Average population firing rate for the ME (solid line) and MS (dashed line) neurons in the two-pool model as a function of directional difference between the sample and test. Black line, Control; gray line, doubled sensory input strength. The difference in the activity of ME and MS neurons is only slightly affected by the increase in the input strengths, whereas the firing rates in both populations increase significantly. C, Average population firing rate for the addition population in the one-pool model as a function of directional difference between the sample and test. Black line, Control; gray line, doubled sensory input strength. The black dashed line indicates the firing rate threshold for match versus nonmatch decisions, obtained by fitting the parameters of the readout (Eq. 14) so as to match the psychometric functions for the one- and two-pool models in the control condition. D, In the two-pool model, the psychometric threshold and overall performance remain almost the same for the control (black bar) and doubled (gray bar) input strength. In the one-pool model, the overall performance decreases and the psychometric threshold increases with the input strength. For the doubled input strengths (gray bar), performance drops to the chance level (dashed line), and the psychometric threshold (defined at 75% correct performance) cannot be determined; for comparison purpose, we plot the maximum possible threshold value, 180°.

References

    1. Abbott LF, Chance FS. Drivers and modulators from push-pull and balanced synaptic input. Prog Brain Res. 2005;149:147–155. - PubMed
    1. Albright TD. Direction and orientation selectivity of neurons in visual area MT of the macaque. J Neurophysiol. 1984;52:1106–1130. - PubMed
    1. Ball K, Sekuler R. Direction-specific improvement in motion discrimination. Vision Res. 1987;27:953–965. - PubMed
    1. Born RT, Bradley DC. Structure and function of visual area MT. Annu Rev Neurosci. 2005;28:157–189. - PubMed
    1. Britten KH, Shadlen MN, Newsome WT, Movshon JA. The analysis of visual motion: a comparison of neuronal and psychophysical performance. J Neurosci. 1992;12:4745–4765. - PMC - PubMed

Publication types

MeSH terms

LinkOut - more resources