. 2011 May 11;31(19):7089-101.
doi: 10.1523/JNEUROSCI.0359-11.2011.

The polymodal ion channel transient receptor potential vanilloid 4 modulates calcium flux, spiking rate, and apoptosis of mouse retinal ganglion cells

Affiliations

The polymodal ion channel transient receptor potential vanilloid 4 modulates calcium flux, spiking rate, and apoptosis of mouse retinal ganglion cells

Daniel A Ryskamp et al. J Neurosci. .

Abstract

Sustained increase in intraocular pressure represents a major risk factor for eye disease, yet the cellular mechanisms of pressure transduction in the posterior eye are essentially unknown. Here we show that the mouse retina expresses mRNA and protein for the polymodal transient receptor potential vanilloid 4 (TRPV4) cation channel known to mediate osmotransduction and mechanotransduction. TRPV4 antibodies labeled perikarya, axons, and dendrites of retinal ganglion cells (RGCs) and intensely immunostained the optic nerve head. Müller glial cells, but not retinal astrocytes or microglia, also expressed TRPV4 immunoreactivity. The selective TRPV4 agonists 4α-PDD and GSK1016790A elevated [Ca2+]i in dissociated RGCs in a dose-dependent manner, whereas the TRPV1 agonist capsaicin had no effect on [Ca2+](RGC). Exposure to hypotonic stimulation evoked robust increases in [Ca2+](RGC). RGC responses to TRPV4-selective agonists and hypotonic stimulation were absent in Ca2+ -free saline and were antagonized by the nonselective TRP channel antagonists Ruthenium Red and gadolinium, but were unaffected by the TRPV1 antagonist capsazepine. TRPV4-selective agonists increased the spiking frequency recorded from intact retinas recorded with multielectrode arrays. Sustained exposure to TRPV4 agonists evoked dose-dependent apoptosis of RGCs. Our results demonstrate functional TRPV4 expression in RGCs and suggest that its activation mediates response to membrane stretch leading to elevated [Ca2+]i and augmented excitability. Excessive Ca2+ influx through TRPV4 predisposes RGCs to activation of Ca2+ -dependent proapoptotic signaling pathways, indicating that TRPV4 is a component of the response mechanism to pathological elevations of intraocular pressure.


Figures

Figure 1.
Figure 1.
Expression of TRPV4 at the mRNA and protein levels in mouse retina. A, PCR amplicons for Trpv4 and glyceraldehyde-3-phosphate dehydrogenase (Gapdh) isolated from total retinal RNA pool and separated on a 2% agarose gel. B, TRPV4 antibody recognizes a primary band of 85 kDa and a secondary band at 105 kDa in wild-type adult mouse retina. No signal is detected in TRPV4−/− retinas. C, TRPV4 antibody recognized a major 105 kDa band in TRPV4-expressing HEK293 cell cultures and trigeminal ganglion tissue; no signal was apparent in a TRPV4 nonexpressor line. D, Nodose ganglion. TRPV4-IR is observed in wild-type (Di) but not TRPV4−/− (Dii) tissue.
Figure 2.
Figure 2.
TRPV4 immunoreactivity in the mouse retina. A, Vertical section of mouse retina. TRPV4-IR is expressed in ganglion cell somata and throughout the ipl. TRPV-IR in the onl is expressed in vertical fibers of Müller glial cells which run through this layer. Scale bars: (in A) AC, IM, 20 μm; (in A) DG, 15 μm; (in A) H, 40 μm. B, Absence of specific TRPV4 immunostaining in the retina of a TRPV4-null mouse. C, Transgenic retina produced by recombineering with copGFP sequence inserted cis- to the Trpv4 promoter (see Materials and Methods). GFP (red) is localized to cytosol of retinal ganglion cells. D, Colocalization of TRPV4-IR (green) and Brn3a-IR (red), a ganglion cell-specific protein in ganglion cell somata. Additional TRPV4-IR is seen in a ganglion cell dendrite (arrow) and in the ofl, which contains ganglion cell axons en route to the optic nerve. E, Colocalization of TRPV4-IR (green) and GFP-IR (red) in a mouse line in which CFP was coupled to the promoter of Thy-1, a ganglion cell specific protein. Colocalization is seen both in the ganglion cell bodies (yellow) and in a ganglion cell dendrite (arrow). F, TRPV4-IR in ganglion cell bodies (green) does not colocalize with GAD-65-IR (red). G, TRPV4-IR (green) does not colocalize with ChAT-IR (red) seen in cell bodies of starburst amacrine cells (red) and in two discrete horizontal bands in the ipl. A labeled ganglion cell body is indicated by an asterisk. H, Montage of the optic nerve (on) showing immunolabeling of optic nerve fibers with TRPV4 (green). Cell nuclei are stained with Sytox Orange. bv, Blood vessel; ret, retina. I, Higher-magnification view of the optic nerve, illustrating that TRPV4-IR (green) is confined to optic nerve axons, whereas astrocytes labeled with a GFAP antibody (red) do not colocalize with TRPV4-IR. J, Vertical section of retina illustrating ganglion cells labeled with the TRPV4 antibody. GFAP-IR-labeled astrocytes in the ofl (red) do not colocalize with TRPV4. K, Vertical section of retina illustrating boundary between ofl and on. TRPV4-IR (green) is seen within these layers, and it colocalizes with intermediate filament immunoreactivity (SMI-32; red). The merged portions appear yellow. L, Vertical section of retina illustrating a displaced ganglion cell (asterisk) at the inl/ipl border that colocalizes with TRPV4-ir (green) and GFP-IR in mice in which GFP is coupled to the Thy-1 promoter. Amacrine cell bodies at this same interface do not label with either antibody. A labeled ganglion cell (yellow profile) in the gcl is seen at bottom. M, Vertical section of retina labeled with antibodies against TRPV4 (red) and Alexa fluor-conjugated rat anti-mouse CD11B (green), a microglial-specific antibody. TRPV4-IR is seen in ganglion cell bodies and Müller glial cell processes. Two labeled microglial cells do not colocalize with TRPV4-IR.
Figure 3.
Figure 3.
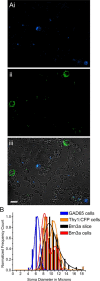
TRPV4 is not expressed in amacrine cells. A, Double labeling for GAD-65-IR (Ai; blue), TRPV-IR (Aii; green), and superimposed transmitted image (Aiii) shows that TRPV4 signals are expressed in a population of cells that is distinct from GABAergic amacrine cells. Scale bar, 10 μm. B, The distribution of cell diameters from dissociated RGCs that were (Brn3a) or were not (Thy1:CFP+) fixed, overlaps with Brn3a-IR somata from retinal sections. Little overlap in diameter distributions is seen between the RGC cohorts and GABAergic cells.
Figure 4.
Figure 4.
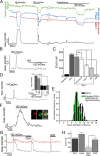
TRPV4 agonists selectively elevate [Ca2+]i in mouse RGCs. A, Brn3a-IR (Ai) and TRPV4 (Aii) colocalize in two RGCs (Aiii). TRPV4-IR is absent from putative amacrine somata (asterisks). Scale bar, 5 μm. B, Application of GSK1016790A or 4α-PDD induces Ca2+ influx into two simultaneously recorded RGCs. C, Four retinal cells immunostained for Brn3a and TRPV4. The cell that responded to GSK with [Ca2+]i increase, but not nonresponders, exhibited colocalization of Brn3a (i) and TRPV4 (ii) immunoreactivity after fixation and immunolabeling. iii, Transmitted image with superimposed TRPV4 and Brn3a signals. Scale bar, 5 μm. D, GSK-induced [Ca2+]i responses are antagonized by Ruthenium Red (RR). E, Simultaneous recording from a putative RGC (red trace) and a putative amacrine cell (black trace) stimulated with 4α-PDD. Ruthenium Red antagonizes TRPV4 agonist responses evoked in the RGC. The amacrine cell is unresponsive to 4α-PDD; however, Ruthenium Red slightly reduced baseline [Ca2+]i in this cell (arrowhead). F, Putative RGC, stimulated with GSK in the presence and absence of extracellular Ca2+. Extracellular calcium is required for agonist-evoked [Ca2+]i elevations. Inset, Comparison of [Ca2+]i for glutamate, GSK, baseline levels in Ca2+-free saline and in 0 Ca2+ + 25 nm GSK. G, Cumulative [Ca2+]i for calibrated RGC baseline and responses to glutamate (100 μm), GSK (25 and 100 nm), GSK (25 nm) + Ruthenium Red (10 μm) and Ruthenium Red alone. *p < 0.05; **p < 0.001; ***p < 0.0001. H, Distribution of cell diameters for dissociated RGCs (Thy1:CFP and Brn3-IR cells; black trace) and putative RGCs that responded to TRPV4 agonists (green trace).
Figure 5.
Figure 5.
GSK-induced [Ca2+]i dynamics in an RGC. A, Transmitted image of a putative RGC and rod photoreceptor. Scale bar, 5 μm. The temporal progression of upper and lower image sequences is illustrated by the adjacent traces. B, G, Unstimulated cells perfused with control saline. C, D, The RGC responds to the bath application of glutamate with a large increase in [Ca2+]i. E, F, Washout. Scale bar: F, 340/380 ratio level. HK, Application of GSK transiently elevates [Ca2+]i in the RGC but not the rod. J, K, [Ca2+]i levels decline in the continued presence of GSK. L, Washout.
Figure 6.
Figure 6.
Cell stretch elevates [Ca2+]RGC. A, Simultaneous recording of RGC volume (calcein, green trace), 340 nm (red trace), 380 nm (blue trace) intensities, and [Ca2+]i (fura-2 ratio, black trace). An increase in RGC volume was indicated by a drop in calcein fluorescence intensity during hypotonic stimulation (decreased osmolarity in superfusing saline from 280 to 192 mOsm). Glutamate stimulation increased [Ca2+]i but evoked no change in the calcein signal. The increase in [Ca2+]i induced by hypotonic stimulation was antagonized by Gd3+. B, Hypotonically induced [Ca2+]i elevations are antagonized by Ruthenium Red. C, Cumulative total for calibrated RGC [Ca2+]i responses to glutamate (100 μm), hypotonic stimulation (192 mOsm), and hypotonic stimulation in the presence of capsazepine, Ruthenium Red (10 μm) or Gd3+ (100 μm). NS, p > 0.05; *p < 0.05; **p < 0.001; ***p < 0.0001. D, [Ca2+]i trace from a GSK-sensitive RGC. Hypotonically evoked [Ca2+]i increase requires Ca2+ influx from the extracellular space. Inset, Relative [Ca2+]i totals for control and hypotonically stimulated RGCs with and without the presence of extracellular calcium. E, Distribution of cell diameters from dissociated RGCs (Thy1:CFP and Brn3-IR cells; black trace) and the hypotonicity-responding cohort (green trace). F, Hypotonicity-responding cell, labeled with TRPV4 and Brn3a antibodies. Scale bar, 10 μm. G, Hypotonicity-induced membrane stretch occludes the response to GSK. The volume decrease following the hypotonic step was associated with a transient increase in [Ca2+]i. H, Cumulative calibrated responses to glutamate (100 μm), hypotonic stimulation (190–195 mOsm), GSK (25 nm) and GSK in the presence of hypotonic stretch shows a marked reduction in the amplitude of the TRPV4 agonist-evoked response during mechanical stimulation.
Figure 7.
Figure 7.
TRPV4 agonists transiently increase spontaneous firing rate of RGCs. A, The spontaneous firing rates of three RGCs recorded on a multielectrode array are shown during the application of GSK at time 0 (300 nm; black bar). The rate increased for 2–3 min before returning to the initial baseline level during the continued presence of the drug for nearly all responsive cells. B, A histogram of the change in firing rates of individual RGCs during the 3 min after 4α-PDD (5 μm) application compared with the pretreatment firing rate is shown for all cells recorded from three treated retinas. Cells with a rate double or higher in drug are combined in the rightmost bin (>100; arrow); nearly half of the cells were in this category, and most cells increased their firing. As with GSK, the increase was transient (not illustrated). C, Histogram as in B, but here the applied drug was GSK (100 or 300 nm; N = 4 retinas). As in B, cells with a spike rate double or higher during the initial period of drug exposure are combined in the rightmost bin (>100; arrow), constituting >12% of the recorded cells. The bias in the distribution to positive values reveals that most cells increased firing in response to GSK application.
Figure 8.
Figure 8.
Exposure to TRPV4 agonist induces RGC apoptosis. A, TUNEL (FITC) + transmitted image in control dissociated mouse retinal cells. No TUNEL staining is observed under control conditions. B, TUNEL staining + transmitted image. Cells were exposed to kainate (KA; 10 μm) for 1 h. Ci, Cii, Transmitted image and TUNEL staining in cells exposed for 1 h to 25 nm GSK. Arrowheads point at putative RGCs; arrows point at putative photoreceptors. Scale bars, 10 μm. D, Cumulative data for putative photoreceptors (cell diameters 3–5 μm) and putative RGCs (cell diameters >6 μm) in L15 medium, 25 nm GSK, 100 nm GSK, and KA in all experiments. **p <0.001; ***p < 0.0001.

Similar articles

Cited by

References

    1. Agar A, Li S, Agarwal N, Coroneo MT, Hill MA. Retinal ganglion cell line apoptosis induced by hydrostatic pressure. Brain Res. 2006;1086:191–200. - PubMed
    1. Alessandri-Haber N, Dina OA, Chen X, Levine JD. TRPC1 and TRPC6 channels cooperate with TRPV4 to mediate mechanical hyperalgesia and nociceptor sensitization. J Neurosci. 2009;29:6217–6228. - PMC - PubMed
    1. Andrade YN, Fernandes J, Vázquez E, Fernández-Fernández JM, Arniges M, Sánchez TM, Villalón M, Valverde MA. TRPV4 channel is involved in the coupling of fluid viscosity changes to epithelial ciliary activity. J Cell Biol. 2005;168:869–874. - PMC - PubMed
    1. Becker D, Blase C, Bereiter-Hahn J, Jendrach M. TRPV4 exhibits a functional role in cell-volume regulation. J Cell Sci. 2005;118:2435–2440. - PubMed
    1. Benfenati V, Amiry-Moghaddam M, Caprini M, Mylonakou MN, Rapisarda C, Ottersen OP, Ferroni S. Expression and functional characterization of transient receptor potential vanilloid-related channel 4 (TRPV4) in rat cortical astrocytes. Neuroscience. 2007;148:876–892. - PubMed

Publication types

MeSH terms

Substances