. 2011 May 11;31(19):7212-21.
doi: 10.1523/JNEUROSCI.0711-11.2011.

The parkinsonian mimetic, MPP+, specifically impairs mitochondrial transport in dopamine axons

Affiliations

The parkinsonian mimetic, MPP+, specifically impairs mitochondrial transport in dopamine axons

Jeong Sook Kim-Han et al. J Neurosci. .

Abstract

Impaired axonal transport may play a key role in Parkinson's disease. To test this notion, a microchamber system was adapted to segregate axons from cell bodies using green fluorescent protein-labeled mouse dopamine (DA) neurons. Transport was examined in axons challenged with the DA neurotoxin, 1-methyl-4-phenylpyridinium ion (MPP+). MPP+ rapidly reduced overall mitochondrial motility in DA axons; among motile mitochondria, anterograde transport was slower yet retrograde transport was increased. Transport effects were specific for DA mitochondria, which were smaller and transported more slowly than their non-DA counterparts. MPP+ did not affect synaptophysin-tagged vesicles or any other measureable moving particle. Toxin effects on DA mitochondria were not dependent upon ATP, calcium, free radical species, JNK, or caspase3/PKC pathways but were completely blocked by the thiol-anti-oxidant N-acetyl-cysteine or membrane-permeable glutathione. Since these drugs also rescued processes from degeneration, these findings emphasize the need to develop therapeutics aimed at axons as well as cell bodies to preserve "normal" circuitry and function as long as possible.


Figures
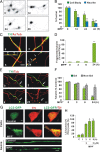
Figure 1.
Figure 1.
Neurite degeneration, microtubule disruption, and autophagy precede DA cell death following MPP+ treatment. A, Dissociated DA neurons were treated with 1 μm MPP+ for indicated times and then fixed and immunostained with rabbit polyclonal anti-TH antibody. B, Quantification of TH-positive cell bodies and neurites remaining after toxin treatment. Numbers of TH-positive cell bodies and neurites were counted using Stereo Investigator. Neurites were significantly reduced after 12 h of treatment, whereas the number of cell bodies did not significantly change until 24 h. Data denote the mean ± SEM of representative determinations made in three independent experiments. C, Integrity of microtubule tracks was assessed by measuring tubulin fragmentation before and after MPP+ treatment. Compartmented axons (described below) were fixed after 3, 6, and 24 h of MPP+ treatment and stained with antibodies directed against AcTub and TH. Beading is seen as early as 6 h (insert, arrowheads) and fragmentation at 24 h (arrow). D, TH-positive axons with fragmented acetylated tubulin were quantified. One hundred to three hundred TH-positive axons were counted per dish and three dishes were counted per group. E, Integrity of microtubule tracks was also assessed by transfecting tubulin-mCherry into DA/GFP cultures at DIV6. Following the addition of 2 μm MPP+, live images were acquired at the indicated times. F, Tubulin intensity was expressed as percentage control. Mean ± SEM made in three independent experiments, *p < 0.05, **p < 0.001, compared to 0 h; #p < 0.05, compared to DA at 24 h. G, Autophagy was assessed by introducing a GFP-tagged LC3 expression clone at DIV6 and treating DA neurons 1 d later with 2 μm MPP+. The formation of LC3-positive granules was measured as indicated by immunostaining. Lower panels show LC3 fluorescence within TH-positive axons before (top) and after (bottom) toxin treatment. For clarity, only LC3 fluorescence in axons is shown. H, The number of TH-positive neurons with at least three LC3-GFP granules was counted and expressed as percentage of all neurons that were both TH positive and LC3-GFP positive, regardless of whether the LC3-GFP signal in these neurons was diffuse or punctuate. Scale bars: A, C, E, 10 μm, G, 1 μm. H, Mean ± SEM in three independent experiments, *p < 0.05. In all bar graphs, hatching indicates toxin treatment.
Figure 2.
Figure 2.
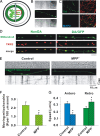
MPP+ rapidly decreases mitochondrial movement in DA axons as shown by mtDendra2. A, Diagram of microchamber device. B, Transmitted light image of segregated axons derived from DIV12 DA/GFP cultures in the top panel, GFP fluorescence in the middle panel, and the merged image in the bottom panel showing TH-positive and TH-negative axons in same field. C, Immunostaining of the axonal side with TH, the axonal marker Tau, and the dendritic marker MAP2. Tau but not MAP2-positive processes is present on axonal side. Scale bar, 10 μm. D, mtDendra2 colocalizes with TMRE. Despite presence of nonconverted mtDendra2, DA axon is easily identified. E, Axonal movement of mitochondria. Mitochondria labeled with mtDendra2 were imaged for 5 min at 5 s intervals after 30 min incubation with and without 2 μm MPP+. For consistency, mitochondrial measurements were assessed near the axon terminal at least 2 mm away from the cell bodies. Resulting kymographs are shown below. F, Number of moving mitochondria per 100 μm length of axon was calculated. G, Speed was calculated as described in Materials and Methods. F, G, Mean ± SEM, *p < 0.05, total of 17 (control) and 14 (MPP+-treated) axons derived from at least 7 dishes in 3 independent experiments. The anterograde speed (Antero) was decreased and the retrograde speed (Retro) increased as early as 30 min after MPP+ treatment. Scale bars: B–D, 10 μm. Hatching indicates toxin treatment.
Figure 3.
Figure 3.
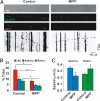
MPP+ rapidly decreases mitochondrial movement in DA axons as shown by MitoTracker Red. A, Axonal movement of mitochondria. Mitochondria were labeled with 25 nm MTR and imaged for 5 min at 5 s intervals after 30 min of incubation with and without 2 μm MPP+. Mitochondrial measurements were assessed as described in Figure 2. Resulting kymographs are shown below. B, Total and moving mitochondria were counted and the rate of motile mitochondria was calculated. C, Speed was calculated as described in Materials and Methods. B, C, Mean ± SEM, *p < 0.05, total of 114 (control) and 175 (MPP+-treated) axons from 15 and 28 dishes in 13 independent experiments. Total length of control and MPP+-treated axons sampled were 10,716 and 16,732 μm, respectively, and the total numbers of mitochondria examined were 1762 and 2632, respectively. The anterograde speed (Antero) was decreased and the retrograde speed (Retro) increased as early as 30 min after MPP+ treatment. Hatching indicates toxin treatment.
Figure 4.
Figure 4.
MPP+ does not affect axonal movement of synaptic vesicles. Dissociated DA/GFP cultures were transduced with Syn-Cer lentivirus at DIV2. Vesicular movement was assessed on DIV12–13 before and after toxin treatment. A, Although some vesicles were clumped and appeared to overlap mitochondria, individual vesicles labeled with Syn-Cer (arrows) were also visualized adjacent to mitochondria labeled with MTR (arrowheads). B, Vesicular movement was observed for 5 min before and after 30 min of incubation with and without 2 μm MPP+. Because of the smaller size of vesicular particles and the relative “dimness” of the cerulean emission, tracks of moving particles are shown below for clarity. C, D, Quantification of moving particles (C) and speed (D) were determined as described in Materials and Methods. Scale bar: 10 μm. Mean ± SEM, ns, nonsignificant, total of 25 (control) and 38 (MPP+-treated) axons from 4 and 5 dishes in 4 independent experiments. Total lengths of control and MPP+-treated axons sampled were 2247 and 3497 μm, respectively. Hatching indicates toxin treatment.
Figure 5.
Figure 5.
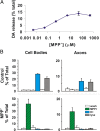
MPP+ rapidly leads to DA efflux. [3H]DA release assays were performed exactly as we have described previously except that 10 min treatment windows were used instead of 6 min (Lotharius and O'Malley, 2000). A, MPP+ dose–response curve; EC50 for DA release is 0.42 ± 0.04 μm (mean ± SEM). B, MPP+-mediated DA release can also be assessed in segregated axons. Each chamber was briefly incubated with [3H]DA, washed extensively with PBS, and then treated with or without 1 μm MPP+ for 10 min. Chambers were washed and then treated with 60 mm K+ to release vesicular contents and finally lysed to assess remaining DA levels (Lotharius and O'Malley, 2000). In the top panels, high K+ releases 50–60% of intracellular DA levels in control cell bodies (left) and axons (right) whereas, 1 μm MPP+ releases >95% (bottom panels). Axon-only chamber represented about 25% of transmitter levels in cell body chamber.
Figure 6.
Figure 6.
MPP+ rapidly depolarizes DA mitochondria. A, Mitochondria in axons from DA/GFP cultures were labeled with 25 nm TMRE and then assessed before and 30 min after MPP+ treatment. Scale bar: 5 μm B, MPP+ led to significant differences in ΔΨm as measured in arbitrary units (AU; arrows). C, Cross sectional areas of mitochondria labeled with MTR were measured before and after toxin treatment using ImageJ particle analysis. Hatching indicates toxin treatment. B, C, Mean ± SEM of representative determinations from three independent experiments, **p < 0.001.
Figure 7.
Figure 7.
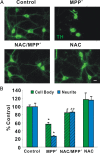
NAC protects DA cell bodies and neurites from MPP+-induced degeneration. A, Dissociated DA neurons were pretreated with 2.5 mm NAC for 18 h, treated with 2 μm MPP+ for 24 h, and then fixed and immunostained with rabbit polyclonal anti-TH antibody. Scale bar: 10 μm B, Quantification of TH-positive cell bodies and neurites. Cell bodies and neurites were significantly protected by NAC. Mean ± SEM from three independent experiments, *p < 0.05, compared to control, #p < 0.05, ##p < 0.001, compared to MPP+.

Similar articles

Cited by

References

    1. Abe N, Cavalli V. Nerve injury signaling. Curr Opin Neurobiol. 2008;18:276–283. - PMC - PubMed
    1. Ali SF, David SN, Newport GD, Cadet JL, Slikker W., Jr MPTP-induced oxidative stress and neurotoxicity are age-dependent: evidence from measures of reactive oxygen species and striatal dopamine levels. Synapse. 1994;18:27–34. - PubMed
    1. Araki T, Sasaki Y, Milbrandt J. Increased nuclear NAD biosynthesis and SIRT1 activation prevent axonal degeneration. Science. 2004;305:1010–1013. - PubMed
    1. Benard G, Bellance N, James D, Parrone P, Fernandez H, Letellier T, Rossignol R. Mitochondrial bioenergetics and structural network organization. J Cell Sci. 2007;120:838–848. - PubMed
    1. Brown A. Axonal transport of membranous and nonmembranous cargoes: a unified perspective. J Cell Biol. 2003;160:817–821. - PMC - PubMed

Publication types

LinkOut - more resources