. 2011 Jul;156(3):1410-23.
doi: 10.1104/pp.111.177741. Epub 2011 May 11.

Nitric oxide regulates DELLA content and PIF expression to promote photomorphogenesis in Arabidopsis

Affiliations

Nitric oxide regulates DELLA content and PIF expression to promote photomorphogenesis in Arabidopsis

Jorge Lozano-Juste et al. Plant Physiol. 2011 Jul.

Abstract

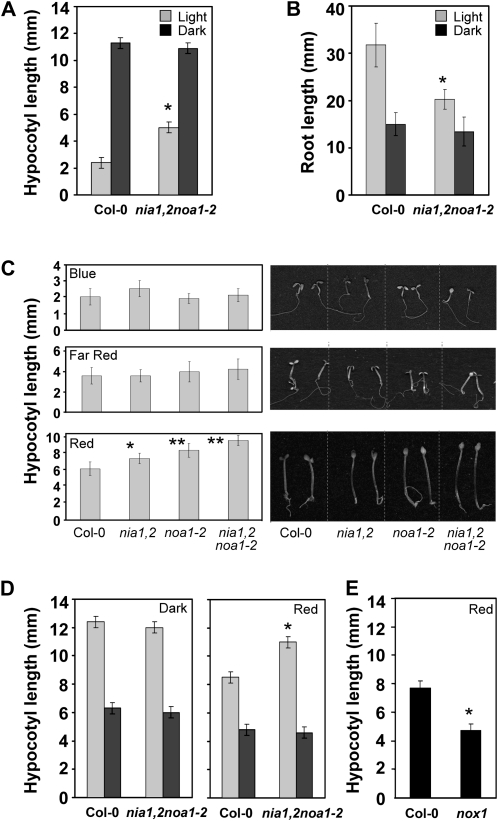
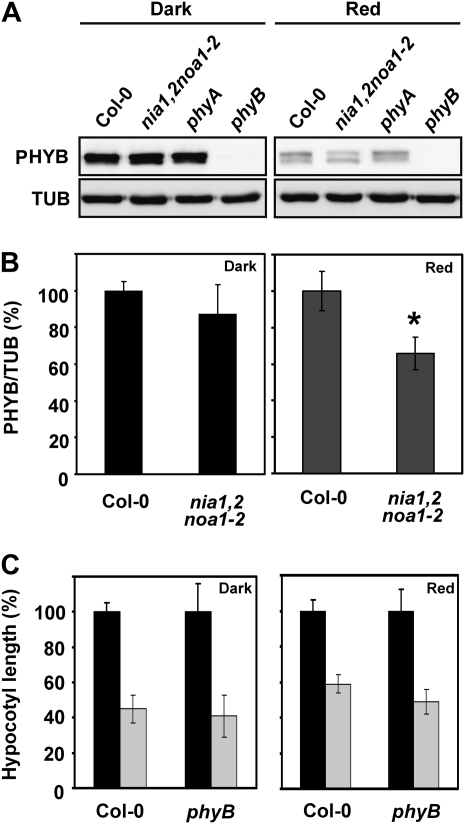
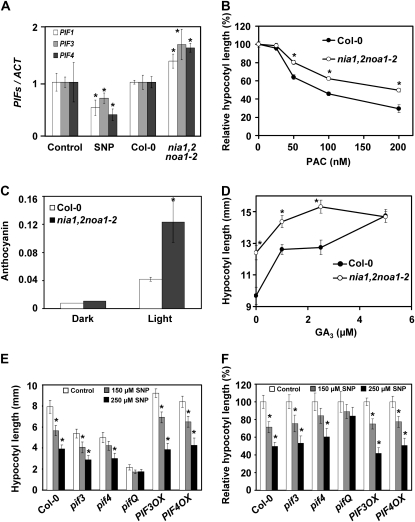
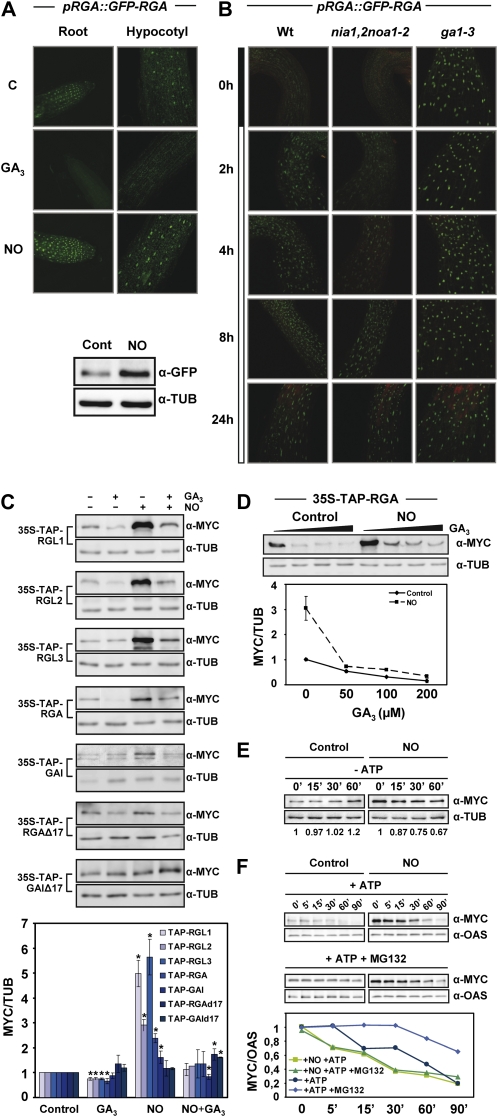
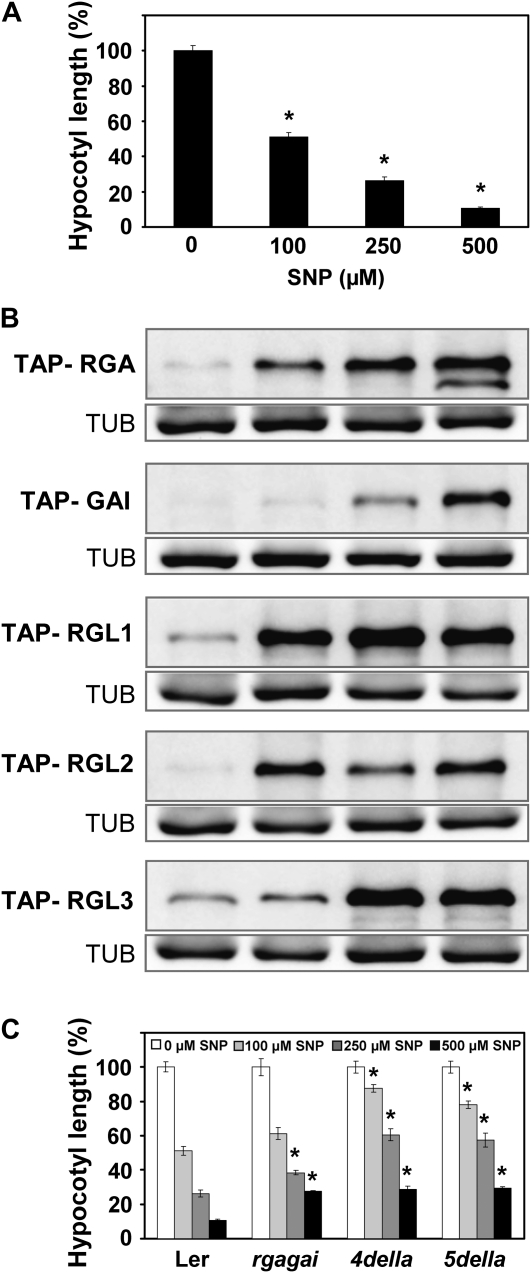
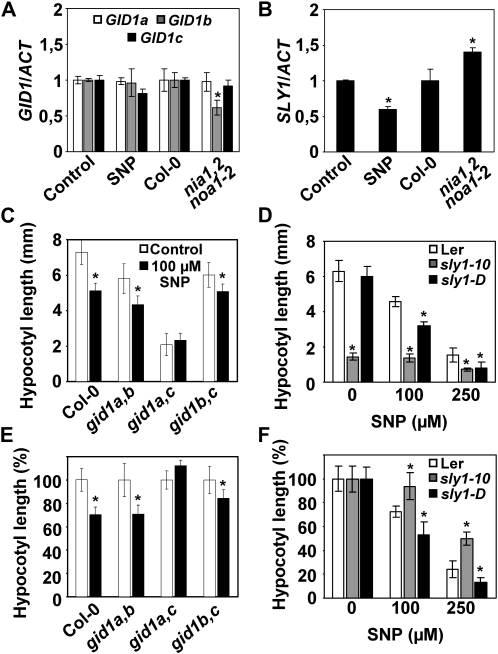
The transition from etiolated to green seedlings involves a shift from hypocotyl growth-promoting conditions to growth restraint. These changes occur through a complex light-driven process involving multiple and tightly coordinated hormonal signaling pathways. Nitric oxide (NO) has been lately characterized as a regulator of plant development interacting with hormone signaling. Here, we show that Arabidopsis (Arabidopsis thaliana) NO-deficient mutant hypocotyls are longer than those from wild-type seedlings under red light but not under blue or far-red light. Accordingly, exogenous treatment with the NO donor sodium nitroprusside and mutant plants with increased endogenous NO levels resulted in reduced hypocotyl length. In addition to increased hypocotyl elongation, NO deficiency led to increased anthocyanin levels and reduced PHYB content under red light, all processes governed by phytochrome-interacting factors (PIFs). NO-deficient plants accordingly showed an enhanced expression of PIF3, PIF1, and PIF4. Moreover, exogenous NO increased the levels of the gibberellin (GA)-regulated DELLA proteins and shortened hypocotyls, likely through the negative regulation of the GA Insensitive Dwarf1 (GID1)-Sleepy1 (SLY1) module. Consequently, NO-deficient seedlings displayed up-regulation of SLY1, defective DELLA accumulation, and altered GA sensitivity, thus resulting in defective deetiolation under red light. Accumulation of NO in wild-type seedlings undergoing red light-triggered deetiolation and elevated levels of NO in the GA-deficient ga1-3 mutant in darkness suggest a mutual NO-GA antagonism in controlling photomorphogenesis. PHYB-dependent NO production promotes photomorphogenesis by a GID1-GA-SLY1-mediated mechanism based on the coordinated repression of growth-promoting PIF genes and the increase in the content of DELLA proteins.


Figures

Figure 1.
Figure 1.
Hypocotyl and root elongation of NO-deficient plants under different light conditions. A, and B, Hypocotyl and root length, respectively, of the wild type and the nia1,2noa1-2 mutant under white light (Light) or darkness (Dark). Hypocotyl and root length were measured in 5- and 10-d-old seedlings, respectively. C, Hypocotyl length was measured in 5-d-old seedlings grown under 16.5 μmol m−2 s−1 blue light, 5 μmol m−2 s−1 far-red light, and 20 μmol m−2 s−1 red light. D, Hypocotyl length in untreated (light gray bars) and NO-treated (250 μm SNP; dark gray bars) Col-0 and nia1,2noa1-2 seedlings. E, Length of the hypocotyls of Col-0 and NO-overproducer nox1 seedlings. Values are means ± se of three independent experiments (at least 20 seedlings per experiment were measured). Asterisks represent statistically significant differential values at * P < 0.005 and ** P < 0.001 when comparing mutant versus the wild type under the same treatment conditions.
Figure 2.
Figure 2.
PHYB protein levels in wild-type Col-0, NO-deficient nia1,2noa1-2, phyA, and phyB mutants grown in darkness or red light. A, Western blots with anti-PHYB antibodies of protein samples from representative hypocotyls of the indicated genotypes grown for 3 d under darkness or 7 μmol m−2 s−1 red light. Western blots with anti-tubulin (TUB) are shown as loading controls. B, Quantification of PHYB levels normalized to TUB and expressed relative to the levels of Col-0. Values are means of three independent experiments ± sd. C, Relative hypocotyl length of untreated (black bars) and NO-treated (250 μm SNP; gray bars) Col-0 and phyB seedlings under dark and red light conditions. Values are means ± se of three independent experiments (at least 20 seedlings per experiment were measured). Asterisks represent statistically significant differential values at P < 0.05 when comparing mutant versus the wild type under the same treatment conditions.
Figure 3.
Figure 3.
Functional connection between NO, GAs, and PIF proteins. A, PIF1, PIF3, and PIF4 transcript levels in Col-0 or nia1,2noa1-2 hypocotyls and on wild-type hypocotyls either treated with 1 mm SNP (NO donor) for 2 h or untreated as a control. B, Relative length of Col-0 and nia1,2noa1-2 hypocotyls (mean ± se) in seedlings exposed to the indicated concentrations of PAC. C, Anthocyanin levels in Col-0 and nia1,2noa1-2 seedlings under dark or white light conditions expressed in arbitrary units of A530. D, Length of Col-0 and nia1,2noa1-2 hypocotyls (mean ± se) treated with the indicated concentrations of GA3. E and F, Total and relative length, respectively, of control untreated and SNP-treated hypocotyls in the indicated genotypes and concentrations. All the experiments were performed with seedlings grown under 20 μmol m−2 s−1 red light unless otherwise mentioned. Values are means of three biological replicates ± se. For hypocotyl length, at least 20 seedlings per independent experiment were measured. Asterisks represent statistically significant differential values with at least P < 0.05 when comparing mutant versus the wild type for the same treatment conditions (A–D) or untreated versus treated samples in each genotype (E and F).
Figure 4.
Figure 4.
Effect of NO on DELLA protein accumulation. A, GFP-RGA in pRGA::GFP-RGA roots and hypocotyls, either untreated (control [C]) or treated for 2 h with 50 μm GA3 or 250 μm SNP as a source of NO, visualized by confocal microscopy. GFP-RGA levels and the loading control tubulin (TUB) were analyzed by western blot. B, GFP-RGA protein in hypocotyls of pRGA::GFP-RGA in wild-type, nia1,2noa1-2, and ga1-3 backgrounds at different times after the shift from darkness to red light, as indicated in the bar at left. C, TAP-tagged versions of every DELLA protein were used to analyze the levels of each protein in seedlings treated (+) or not (−) with 50 μm GA3 and/or 250 μm SNP (NO) for 2.5 h. TAP-DELLAs were detected with anti-MYC antibodies, and the levels of tubulin are shown as a loading control. The values normalized with tubulin and relative to control untreated samples were quantified, and the values shown in the bottom panel correspond to means of three independent experiments ± sd. Asterisks represent statistically significant differential values with at least P < 0.05 when comparing treated versus untreated controls in each genotype. D, GA-induced degradation of RGA in untreated (Control) and NO-treated (NO; as described in C) 35S-TAP-RGA seedlings exposed to increasing GA3 concentrations (0, 50, 100, and 200 μm). Values normalized to tubulin were quantified and are shown in the bottom panel as means of three independent experiments ± se. E and F, Cell-free degradation assay of RGA in the absence (E) or presence (F) of ATP and the proteasome inhibitor MG132. Protein samples were incubated at room temperature for the indicated times and treatment conditions and detected with anti-MYC antibodies. Tubulin or O-acetyl-Ser(thiol)lyase 1 (OAS) was detected as a loading control (D–F). ATP and MG132 were used at 10 mm and 100 μm, respectively. The protein levels detected on western blots in E and F were quantified and normalized to TUB or OAS content.
Figure 5.
Figure 5.
Effect of NO on hypocotyl elongation and DELLA content under red light. A and C, Hypocotyl length of wild-type Ler, rga-24gai-t6, and quadruple (4della) and quintuple (5della) DELLA mutants was measured after growing seedlings in the indicated SNP concentrations for 3 d. Values of hypocotyl length are means ± se of three independent experiments (at least 20 seedlings per experiment were measured). Asterisks represent statistically significant differential values with at least P < 0.05 when comparing hypocotyls of treated versus untreated wild-type seedlings (A) or mutant versus wild-type hypocotyls from different genotypes under the same treatment conditions (C). B, TAP-DELLA accumulation under the SNP concentrations shown in A was detected with anti-MYC antibodies, and the loading controls of tubulin (TUB) are included.
Figure 6.
Figure 6.
Functional connection between NO and the GA signaling components GID1s and SLY1. A and B, GID1s and SLY1 transcript levels normalized to actin in hypocotyls of untreated (Control) and 1 mm SNP-treated wild-type seedlings as well as in the nia1,2noa1-2 mutants and its wild-type background, Col-0. Values are means ± se of three experiments. C and E, Total and relative hypocotyl length, respectively, of different combinations of double gid1 mutants in untreated (white bars) and 100 μm SNP-treated (black bars) seedlings. D and F, Total and relative hypocotyl length of Col-0, the loss-of-function mutant sly1-10, and the gain-of-function mutant sly1-D at the indicated SNP concentrations. For C to F, values of hypocotyl length are means ± se of three independent experiments (at least 20 seedlings per experiment were measured). Asterisks represent statistically significant differential values at P < 0.05 when comparing mutant versus wild-type hypocotyls under the same treatment conditions (A, B, D, and F) or treated versus untreated hypocotyls in each genotype (C and E).
Figure 7.
Figure 7.
NO levels in the wild-type Col-0 and Ler as well as in nia1,2noa1-2, phyB, ga1-3, and gai-1D mutant plants. A, Endogenous NO was visualized with the cell-permeable DAF-FM DA fluorescein in seedlings grown in darkness for 4 d and 1 h after the shift to red light (20 μmol m−2 s−1). B, NO-related fluorescence in Ler, ga1-3, and gai-1D in untreated (Control) and 50 μm GA3-treated seedlings for 2.5 h. Values are shown relative to untreated wild-type levels. The right panel of A and B show the quantification of three independent experiments as mean values of fluorescence (arbitrary units [a.u.]) ± se. Asterisks represent statistically significant differential values at P < 0.05 when comparing controls in darkness (A) or untreated (B).
Figure 8.
Figure 8.
Scheme integrating NO and GA antagonist functions in the control of light-regulated photomorphogenesis through the balance between DELLAs and PIFs.

Similar articles

Cited by

References

    1. Achard P, Cheng H, De Grauwe L, Decat J, Schoutteten H, Moritz T, Van Der Straeten D, Peng J, Harberd NP. (2006) Integration of plant responses to environmentally activated phytohormonal signals. Science 311: 91–94 - PubMed
    1. Achard P, Genschik P. (2009) Releasing the brakes of plant growth: how GAs shut down DELLA proteins. J Exp Bot 60: 1085–1092 - PubMed
    1. Achard P, Liao L, Jiang C, Desnos T, Bartlett J, Fu X, Harberd NP. (2007) DELLAs contribute to plant photomorphogenesis. Plant Physiol 143: 1163–1172 - PMC - PubMed
    1. Achard P, Renou J-P, Berthomé R, Harberd NP, Genschik P. (2008) Plant DELLAs restrain growth and promote survival of adversity by reducing the levels of reactive oxygen species. Curr Biol 18: 656–660 - PubMed
    1. Agrawal L, Chakraborty S, Jaiswal DK, Gupta S, Datta A, Chakraborty N. (2008) Comparative proteomics of tuber induction, development and maturation reveal the complexity of tuberization process in potato (Solanum tuberosum L.). J Proteome Res 7: 3803–3817 - PubMed

Publication types

MeSH terms

LinkOut - more resources