

Opposing effects of monomeric and pentameric C-reactive protein on endothelial progenitor cells
- PMID: 21562922
- PMCID: PMC3149664
- DOI: 10.1007/s00395-011-0191-y
Opposing effects of monomeric and pentameric C-reactive protein on endothelial progenitor cells
Abstract
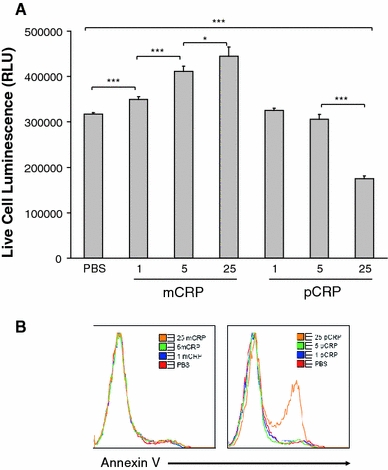
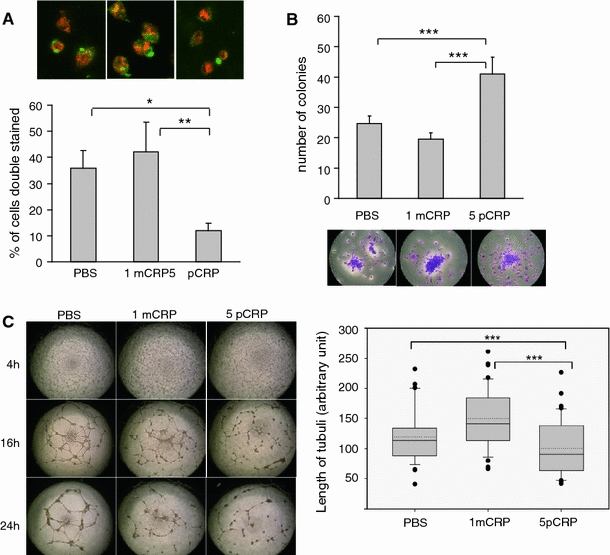
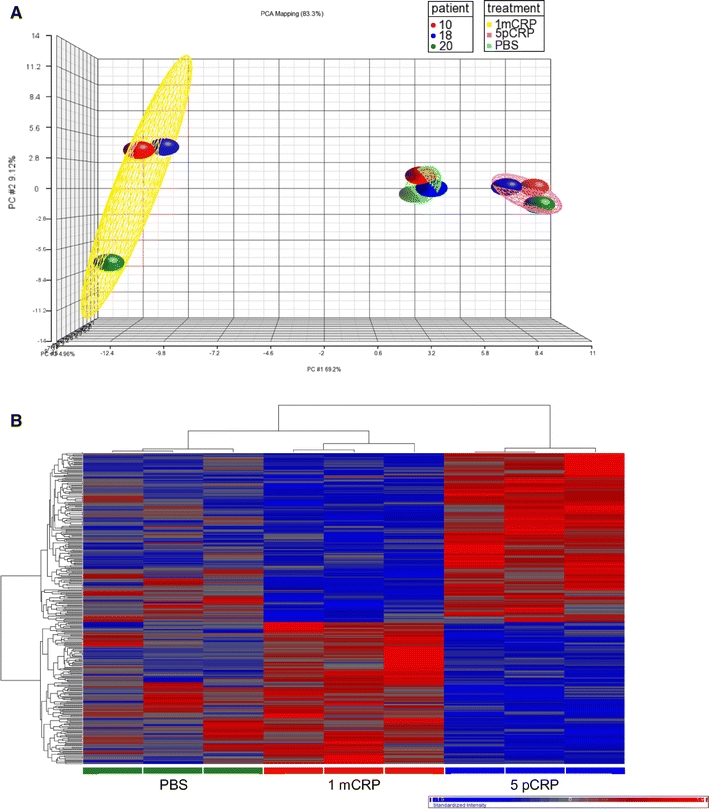
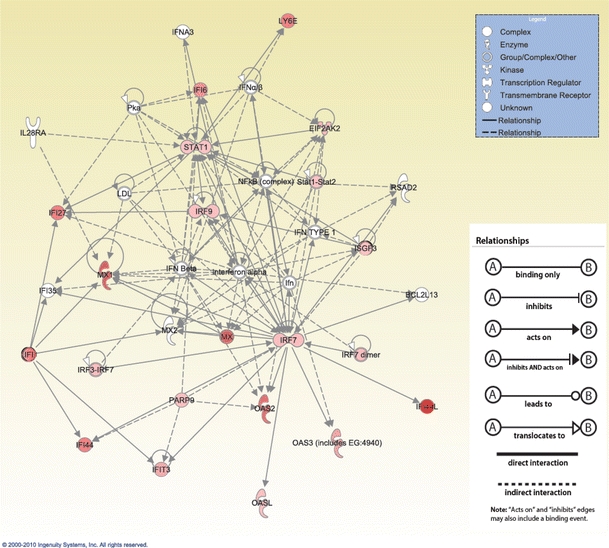
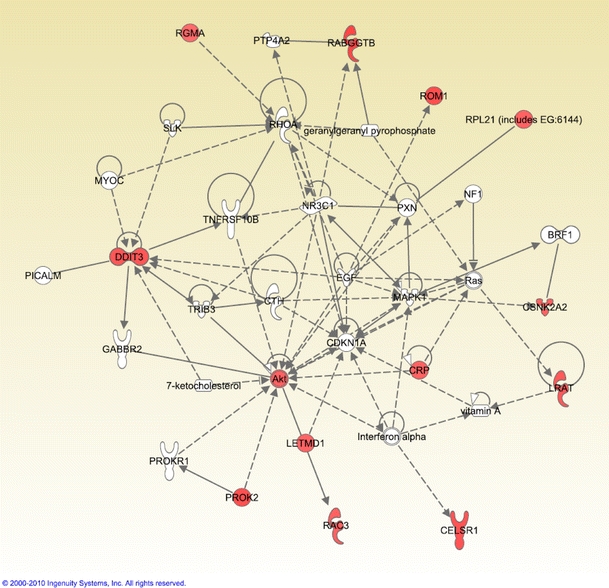
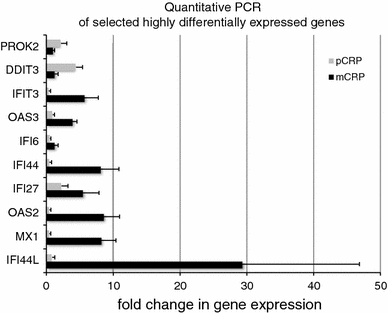
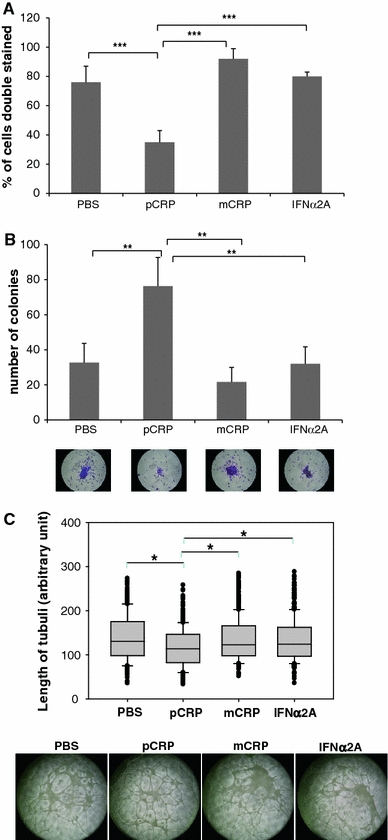
C-reactive protein (CRP) has been linked to the pathogenesis of atherosclerosis. The dissociation of native, pentameric (p)CRP to monomeric (m)CRP on the cell membrane of activated platelets has recently been demonstrated. The dissociation of pCRP to mCRP may explain local pro-inflammatory reactions at the site of developing atherosclerotic plaques. As a biomarker, pCRP predicts cardiovascular adverse events and so do reduced levels and function of circulating endothelial progenitor cells (EPCs). We hypothesised that mCRP and pCRP exert a differential effect on EPC function and differentiation. EPCs were treated with mCRP or pCRP for 72 h, respectively. Phenotypical characterisation was done by flow cytometry and immunofluorescence microscopy, while the effect of mCRP and pCRP on gene expression was examined by whole-genome gene expression analysis. The functional capacity of EPCs was determined by colony forming unit (CFU) assay and endothelial tube formation assay. Double staining for acetylated LDL and ulex lectin significantly decreased in cells treated with pCRP. The length of tubuli in a matrigel assay with HUVECs decreased significantly in response to pCRP, but not to mCRP. The number of CFUs increased after pCRP treatment. RNA expression profiling demonstrated that mCRP and pCRP cause highly contradictory gene regulation. Interferon-responsive genes (IFI44L, IFI44, IFI27, IFI 6, MX1, OAS2) were among the highly up-regulated genes after mCRP, but not after pCRP treatment. In conclusion, EPC phenotype, genotype and function were differentially affected by mCRP and pCRP, strongly arguing for differential roles of these two CRP conformations. The up-regulation of interferon-inducible genes in response to mCRP may constitute a mechanism for the local regulation of EPC function.
Figures
Similar articles
-
C-reactive protein dissociation drives choroidal neovascularization in age-related macular degeneration.Sci Rep. 2025 Aug 26;15(1):31408. doi: 10.1038/s41598-025-16631-z. Sci Rep. 2025. PMID: 40858941 Free PMC article.
-
Dissociation of pentameric to monomeric C-reactive protein on activated platelets localizes inflammation to atherosclerotic plaques.Circ Res. 2009 Jul 17;105(2):128-37. doi: 10.1161/CIRCRESAHA.108.190611. Epub 2009 Jun 11. Circ Res. 2009. PMID: 19520972
-
Shear-Sensing by C-Reactive Protein: Linking Aortic Stenosis and Inflammation.Circ Res. 2024 Nov 8;135(11):1033-1047. doi: 10.1161/CIRCRESAHA.124.324248. Epub 2024 Oct 18. Circ Res. 2024. PMID: 39421928 Free PMC article.
-
C-reactive protein: how conformational changes influence inflammatory properties.Cell Cycle. 2009 Dec;8(23):3885-92. doi: 10.4161/cc.8.23.10068. Epub 2009 Dec 14. Cell Cycle. 2009. PMID: 19887916 Review.
-
Dissociation of C-Reactive Protein Localizes and Amplifies Inflammation: Evidence for a Direct Biological Role of C-Reactive Protein and Its Conformational Changes.Front Immunol. 2018 Jun 12;9:1351. doi: 10.3389/fimmu.2018.01351. eCollection 2018. Front Immunol. 2018. PMID: 29946323 Free PMC article. Review.
Cited by
-
Emerging roles for human glycolipid transfer protein superfamily members in the regulation of autophagy, inflammation, and cell death.Prog Lipid Res. 2020 Apr;78:101031. doi: 10.1016/j.plipres.2020.101031. Epub 2020 Apr 24. Prog Lipid Res. 2020. PMID: 32339554 Free PMC article. Review.
-
Oxidized high-density lipoprotein impairs endothelial progenitor cells' function by activation of CD36-MAPK-TSP-1 pathways.Antioxid Redox Signal. 2015 Feb 1;22(4):308-24. doi: 10.1089/ars.2013.5743. Epub 2014 Dec 2. Antioxid Redox Signal. 2015. PMID: 25313537 Free PMC article.
-
C-reactive protein dissociation drives choroidal neovascularization in age-related macular degeneration.Sci Rep. 2025 Aug 26;15(1):31408. doi: 10.1038/s41598-025-16631-z. Sci Rep. 2025. PMID: 40858941 Free PMC article.
-
C-Reactive Protein in Atherosclerosis-More than a Biomarker, but not Just a Culprit.Rev Cardiovasc Med. 2023 Oct 19;24(10):297. doi: 10.31083/j.rcm2410297. eCollection 2023 Oct. Rev Cardiovasc Med. 2023. PMID: 39077585 Free PMC article. Review.
-
Insights of Chinese medicine on ventricular remodeling: Multiple-targets, individualized-treatment.Chin J Integr Med. 2017 Sep;23(9):643-647. doi: 10.1007/s11655-017-2415-y. Epub 2017 Sep 2. Chin J Integr Med. 2017. PMID: 28861886 Review.
References
-
- Albert MA, Glynn RJ, Ridker PM. Plasma concentration of C-reactive protein and the calculated Framingham Coronary Heart Disease Risk Score. Circulation. 2003;108:161–165. doi: 10.1161/01.CIR.0000080289.72166.CF. - DOI - PubMed
Publication types
MeSH terms
Substances
LinkOut - more resources
Full Text Sources
Medical
Research Materials
Miscellaneous
