. 2011 Mar;33(3):692-7.
doi: 10.1002/jmri.22484.

Imaging of blood flow using hyperpolarized [(13)C]urea in preclinical cancer models

Affiliations

Imaging of blood flow using hyperpolarized [(13)C]urea in preclinical cancer models

Cornelius von Morze et al. J Magn Reson Imaging. 2011 Mar.

Abstract

Purpose: To demonstrate dynamic imaging of a diffusible perfusion tracer, hyperpolarized [(13)C]urea, for regional measurement of blood flow in preclinical cancer models.

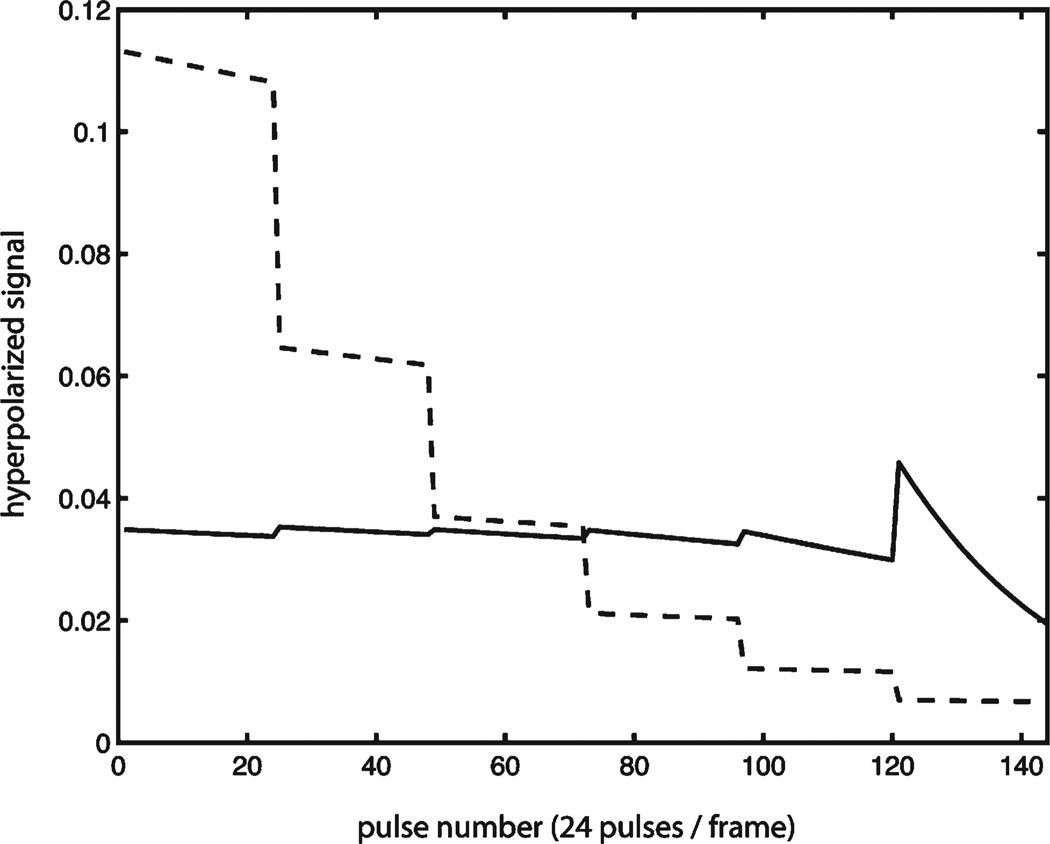
Materials and methods: A pulse sequence using balanced steady state free precession (bSSFP) was developed, with progressively increasing flip angles for efficient sampling of the hyperpolarized magnetization. This allowed temporal and volumetric imaging of the [(13)C]urea signal. Regional signal dynamics were quantified for kidneys and liver, and estimates of relative blood flows were derived from the data. Detailed perfusion simulations were performed to validate the methodology.

Results: Significant differences were observed in the signal patterns between normal and cancerous murine hepatic tissues. In particular, a 19% reduction in mean blood flow was observed in tumors, with 26% elevation in the tumor rim. The blood flow maps were also compared with metabolic imaging results with hyperpolarized [1-(13)C]pyruvate.

Conclusion: Regional assessment of perfusion is possible by imaging of hyperpolarized [(13)C]urea, which is significant for the imaging of cancer.


Figures

Figure 1
Figure 1
The bSSFP pulse sequence for dynamic imaging of hyperpolarized 13C media.
Figure 2
Figure 2
Simulated hyperpolarized bSSFP signal as a function of pulse number (dashed, constant flip angle 12°; solid, progressive flip angle as described in text, progressive over acquisitions but uniform within each acquisition). Sharp signal drops in dotted line correspond to T1 decay during periods of delay between acquisitions. Sharp drop at end of solid line corresponds to larger T2 decay component at higher flip angles.
Figure 3
Figure 3
Perfusion simulation data curves and virtual tumor phantom. Data curves: true measured AIF function (dip is due to saline flush), simulated gamma-variate AIF and resulting liver tissue concentration–time curve (Ct) after convolution with exponential residue function and addition of noise. Sampled time points indicated by dotted lines. Images: True phantom blood flows and MTTs with linear radial parameter variation over a range of likely values. [Color figure can be viewed in the online issue, which is available at wileyonlinelibrary.com.]
Figure 4
Figure 4
Dynamic [13C]urea data. Left: Axial images of hyperpolarized [13C]urea over 30 s in a normal rat (6 s between frames, arranged left-to-right), overlaid on T2-weighted FSE images. Top half: Six time points for slice containing kidneys. Bright spot is vena cava/descending aorta. Bottom half: Six time points for heart and lungs. Right: Dynamic signal curves from representative kidney and liver voxels, and corresponding AIF. [Color figure can be viewed in the online issue, which is available at wileyonlinelibrary.com.]
Figure 5
Figure 5
Simulation results from the virtual tumor phantom, demonstrating feasibility of measurement of tissue blood flow by dynamic imaging of [13C]urea according to the experimental details from this study. Top row: True blood flow (left) and instance of blood flow measurement from a single trial (right). Bottom row: Absolute percent error mean (left) and SD (right) over 500 trials. [Color figure can be viewed in the online issue, which is available at wileyonlinelibrary.com.]
Figure 6
Figure 6
Axial images of hyperpolarized [13C]urea (green, 24-s time point) and [1–13C]lactate (red), overlaid on T2-weighted FSE 1H images (grayscale) of mouse liver, combining results of multiple experiments. Yellow indicates overlap of [13C]urea and [1–13C]lactate. Top row: normal mouse. Rows 2&3: liver tumor mice. Same slice shown at left and right. (Mouse in row 2 is prone, while 1&3 are supine.)

References

    1. Ardenkjaer-Larsen JH, Fridlund B, Gram A, et al. Increase in signal-to-noise ratio of >10,000 times in liquid-state NMR. Proc Natl Acad Sci U S A. 2003;100:10158–10163. - PMC - PubMed
    1. Mansson S, Johansson E, Magnusson P, et al. 13C imaging-a new diagnostic platform. Eur Radiol. 2006;16:57–67. - PubMed
    1. Aime S, Dastru W, Gobetto R, Santelia D, Viale A. Agents for polarization enhancement in MRI. Handb Exp Pharmacol. 2008;(Pt 1):247–272. - PubMed
    1. Bhattacharya P, Ross BD, Bunger R. Cardiovascular applications of hyperpolarized contrast media and metabolic tracers. Exp Biol Med (Maywood) 2009;234:1395–1416. - PubMed
    1. Chen AP, Albers MJ, Cunningham CH, et al. Hyperpolarized C-13 spectroscopic imaging of the TRAMP mouse at 3T-initial experience. Magn Reson Med. 2007;58:1099–1106. - PubMed

Publication types

Substances