

Purification and characterization of meta-cresol purple for spectrophotometric seawater pH measurements
- PMID: 21563773
- PMCID: PMC3103190
- DOI: 10.1021/es200665d
Purification and characterization of meta-cresol purple for spectrophotometric seawater pH measurements
Abstract
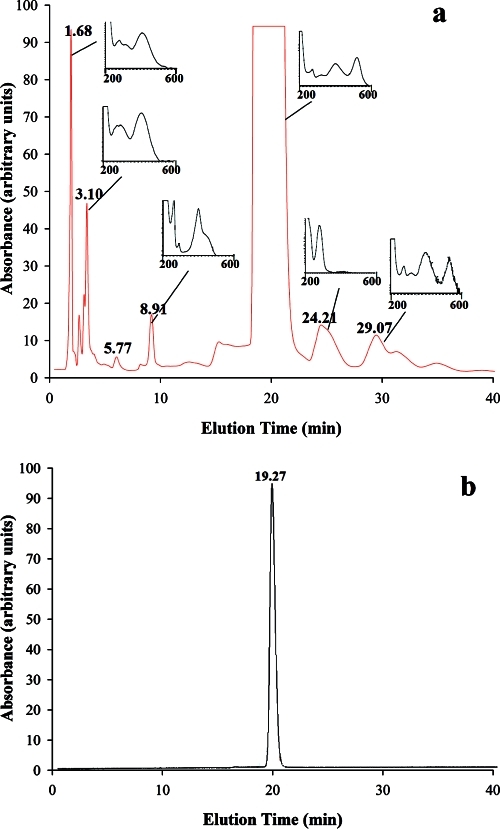
Spectrophotometric procedures allow rapid and precise measurements of the pH of natural waters. However, impurities in the acid-base indicators used in these analyses can significantly affect measurement accuracy. This work describes HPLC procedures for purifying one such indicator, meta-cresol purple (mCP), and reports mCP physical-chemical characteristics (thermodynamic equilibrium constants and visible-light absorbances) over a range of temperature (T) and salinity (S). Using pure mCP, seawater pH on the total hydrogen ion concentration scale (pHT) can be expressed in terms of measured mCP absorbance ratios (R = λ2A/(λ1)A) as follows: [formula in text] where -log(K(2)Te2) = a + (b/T) + c ln T – dT; a = -246.64209 + 0.315971S + 2.8855 × 10(-4)S2; b = 7229.23864 – 7.098137S – 0.057034S2; c = 44.493382 – 0.052711S; d = 0.0781344; and mCP molar absorbance ratios (ei) are expressed as e1 = -0.007762 + 4.5174 × 10(-5)T and e3/e2 = -0.020813 + 2.60262 × 10(-4)T + 1.0436 × 10(-4) (S – 35). The mCP absorbances, λ1A and λ2A, used to calculate R are measured at wavelengths (λ) of 434 and 578 nm. This characterization is appropriate for 278.15 ≤ T ≤ 308.15 and 20 ≤ S ≤ 40.
Figures
References
-
- Robert-Baldo G.; Morris M. J.; Byrne R. H. Spectrophotometric determination of seawater pH using phenol red. Anal. Chem. 1985, 57, 2564–2567.
-
- Byrne R. H.; Breland J. A. High precision multiwavelength pH determinations in seawater using cresol red. Deep-Sea Res., Part A 1989, 36, 803–810.
-
- Clayton T. D.; Byrne R. H. Spectrophotometric seawater pH measurements: total hydrogen ion concentration scale calibration of m-cresol purple and at-sea results. Deep-Sea Res., Part A 1993, 40, 2115–2129.
-
- Clayton T. D.; Byrne R. H.; Breland J. A.; Feely R. A.; Millero F. J.; Campbell D. J.; Murphy P. P.; Roberts M. L. The role of pH measurements in modern oceanic CO2-system characterizations: precision and thermodynamic consistency. Deep-Sea Res. 1993, 42, 411–429.
-
- McElligott S.; Byrne R. H.; Lee K.; Wanninkhof R.; Millero F. J.; Feely R. A. Discrete water column measurements of CO2 fugacity and pHT in seawater: a comparison of direct measurements and thermodynamic calculations. Mar. Chem. 1998, 60, 63–73.
Publication types
MeSH terms
Substances
LinkOut - more resources
Full Text Sources
Other Literature Sources
Molecular Biology Databases
Miscellaneous
