. 2011 Nov;23(11):3598-619.
doi: 10.1162/jocn_a_00047. Epub 2011 May 12.

From an executive network to executive control: a computational model of the n-back task

Affiliations

From an executive network to executive control: a computational model of the n-back task

Christopher H Chatham et al. J Cogn Neurosci. 2011 Nov.

Abstract

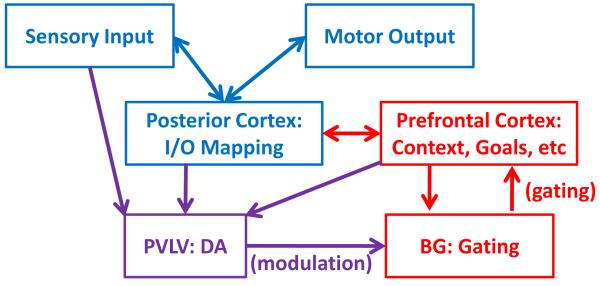
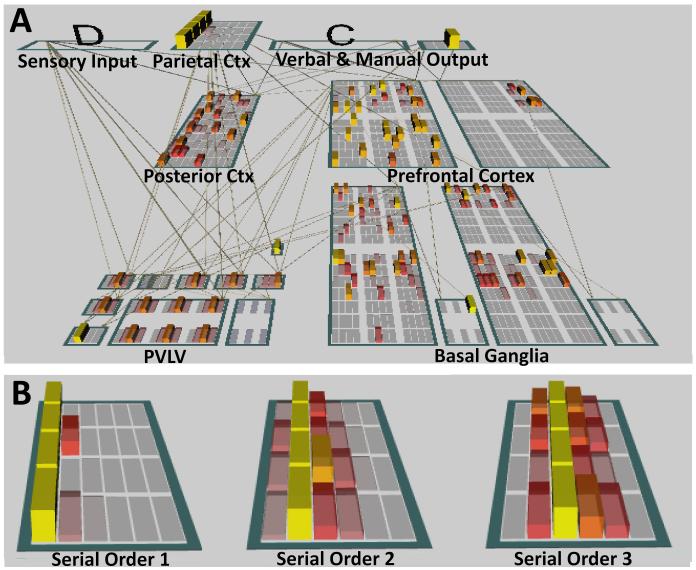
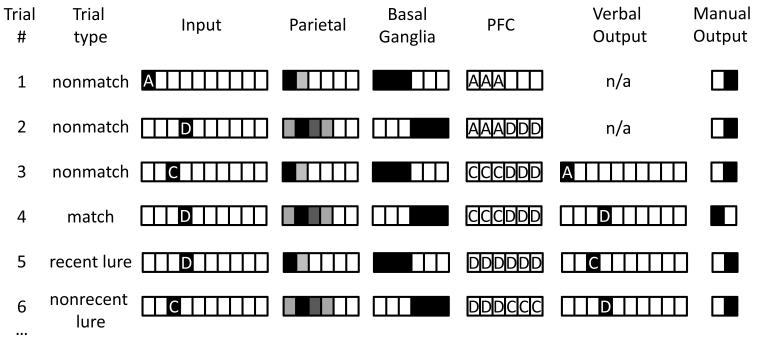
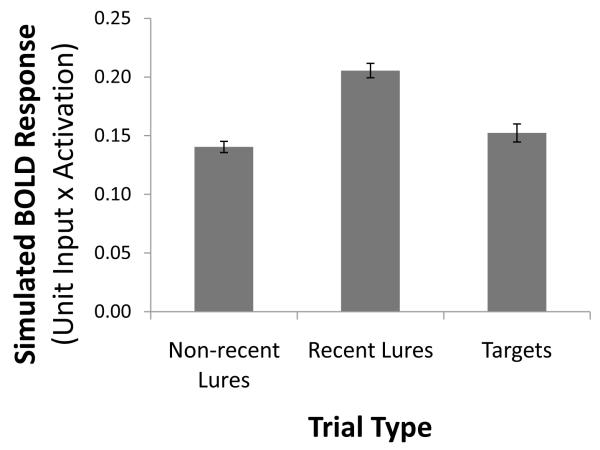
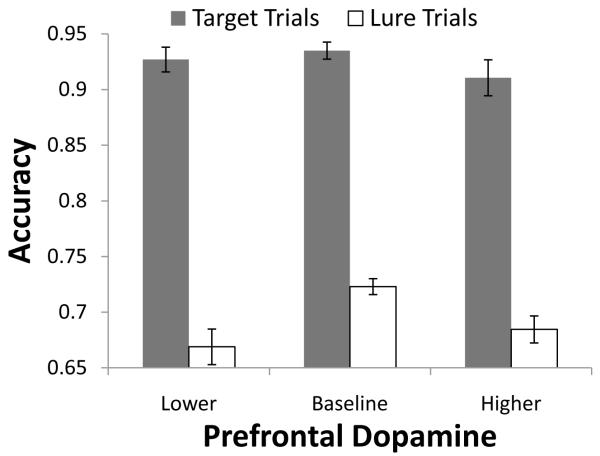
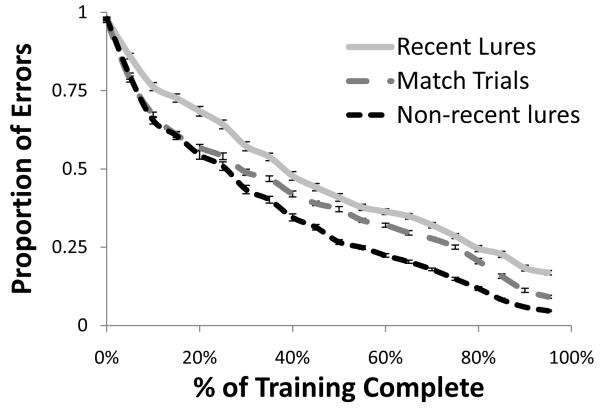
A paradigmatic test of executive control, the n-back task, is known to recruit a widely distributed parietal, frontal, and striatal "executive network," and is thought to require an equally wide array of executive functions. The mapping of functions onto substrates in such a complex task presents a significant challenge to any theoretical framework for executive control. To address this challenge, we developed a biologically constrained model of the n-back task that emergently develops the ability to appropriately gate, bind, and maintain information in working memory in the course of learning to perform the task. Furthermore, the model is sensitive to proactive interference in ways that match findings from neuroimaging and shows a U-shaped performance curve after manipulation of prefrontal dopaminergic mechanisms similar to that observed in studies of genetic polymorphisms and pharmacological manipulations. Our model represents a formal computational link between anatomical, functional neuroimaging, genetic, behavioral, and theoretical levels of analysis in the study of executive control. In addition, the model specifies one way in which the pFC, BG, parietal, and sensory cortices may learn to cooperate and give rise to executive control.


Figures

Figure 1
Figure 1
Schematic illustration of core PBWM architecture, in which prefrontal context representations of relevant prior information and current goals bias the sensory-motor mappings that are learned by posterior cortical “hidden” layers. The prefrontal context representations are updated via dynamic gating by the basal ganglia. These gating functions are learned by the basal ganglia on the basis of input from the PVLV system, which provides modulatory dopaminergic input depending on the reward value of the actions performed by the basal ganglia.
Figure 2
Figure 2
A. The PBWM architecture includes units based on the prefrontal cortex and basal ganglia, including ventral and dorsal striatum, grouped into “stripes” (the visible subgroups within prefrontal and striatal layers). Input is provided to the model about the identity of the current stimulus and its serial order; the model is required to produce a manual output about whether the current stimulus matches that presented n trials previously, and a verbal output corresponding to the identity of the stimulus presented n trials previously. B. The parietal layers represent the serial order of successive trials in terms of n, using a graded and compressive code based on the mean and variance observed in the tuning curves of rank order sensitive neurons in the horizontal segment of the intraparietal sulcus.
Figure 3
Figure 3. A schematic example of a trained model’s inputs, outputs, and “hidden” layer activations on the 2-back task
Trial #1. The network is presented with the input A and a parietal representation corresponding to serial order 1. The three leftmost units for the striatum have learned to fire on trials with this serial order, and therefore gate the stimulus “A” into the corresponding units in the PFC, which has learned to represent “A”. This conjunction of the item “A” in the stripe that has learned to represent information from serial order “1” produces a bound representation that can be termed “A1.” Finally, the network has learned to produce the verbal output corresponding to the 2-back item (n/a here, since this is the first trial), and the manual output corresponding to “nonmatch”, since the current item does not match the item presented 2- back. Trial #2. The network is presented with input “D” and serial order #2 is represented in the parietal layer; the right most units in the striatum fire for this serial order, and therefore gate the stimulus “D” into the corresponding PFC units, producing a bound representation that can be termed “D2.” Trials #3-6. New stimuli are presented, the parietal layer continues to count off the serial order of the current stimulus, and the striatal layer continues to fire at the appropriate times, thereby updating PFC with the current stimulus in the correct set of units. The network produces nonmatch responses for all trials except trial #4, which is a match trial.
Figure 4
Figure 4
A. The model reproduces the benchmark result of lower accuracy on 3-back than 2- back. B. The model shows reduced accuracy on recent (n-1) lures, relative to both non-recent lures (>n) and match trials. In addition, the relative difference of these trial types is smaller in the 3-back task than the 2-back task, consistent with human data.
Figure 5
Figure 5
Recent lures were associated with a greater simulated hemodynamic response than non-recent lures and targets, where the hemodynamic response is simulated as the weighted average of unit inputs and unit activations in the prefrontal cortex layers.
Figure 6
Figure 6
As a proxy for the effects of the polymorphisms in the COMT gene, we manipulated the effects of dopamine in the prefrontal layers of the model. This manipulation revealed an inverted U-shaped curve relating dopamine levels to performance, consistent with the hypothesized effects of varying dopamine levels in prefrontal cortex.
Figure 7
Figure 7
The model captures the individual differences in the relationship of lure and target trial accuracy observed empirically when subjects are encouraged to adopt the same strategy as adopted by our model.
Figure 8
Figure 8
A. The model learns to appropriate gate information into working memory by developing increasingly discrete firing patterns in the striatum over the course of training, here visualized in terms of reductions in entropy. B. Individual differences in the ultimate post-training performance of models across runs can be predicted based on the reduction in striatal entropy much earlier in training: networks that ultimately commit less errors following training (solid vs. dotted lines) show significantly more (* p<.05) discrete patterns of firing between 0 and 10% of the total training time (vertical bars). Shaded regions represent standard error of the mean for each time point.
Figure 9
Figure 9
Cluster plots reflect the Euclidean distance (indicated by the length of horizontal lines) between every item (indicated by letters along the y axis) and serial order (indicated by numbers along the y-axis); thus, if the path from one item to another requires a large amount of horizontal travel, then the representations of those items are relatively distinct. A. One prefrontal stripe shows an initially haphazard pattern of representational similarity across items, as indicated by the lack of systematic clustering between items and their order. B. After training, the same prefrontal stripe illustrated in A develops a highly structured representation, by collapsing across all items of serial order 2 (upper half of cluster plot) but differentiating among all items of serial order 1 (as indicated by the large horizontal lines separating each item; lower half, enclosed by rounded rectangle). This stripe is preferentially tuned to code items of serial order 1. C. A different PFC stripe also shows initially haphazard representational similarity. D. After training this stripe shows a different pattern than that illustrated in B, in that it collapses equally across all items of serial order 1 (upper half of cluster plot) but increasingly differentiates every item occurring with the other serial order (lower half, enclosed by rounded rectangle).
Figure 10
Figure 10
Performance on recent lures trials undergoes a shallower learning curve than performance on all other trial types, reflecting a more rapid reduction in error rate on trials that do not require the resolution of proactive interference (match and non-recent lure trials as compared to recent lures).

References

    1. Aalto S, Brück A, Laine M, Någren K, Rinne JO. Frontal and temporal dopamine release during working memory and attention tasks in healthy humans: A positron emission tomography study using the high-affinity dopamine D2 receptor ligand [11C]FLB 457. Journal of Neuroscience. 2005;25:2471–2477. - PMC - PubMed
    1. Amiez C, Petrides M. Selective involvement of the mid-dorsolateral prefrontal cortex in the coding of the serial order of visual stimuli in working memory. Proceedings of the National Academy of Sciences. 2007;104:13786–13791. - PMC - PubMed
    1. Apud JA, Weinberger DR. Treatment of cognitive deficits associated with schizophrenia: Potential role of catechol-O-methyltransferase inhibitors. CNS Drugs. 2007;21:535–557. - PubMed
    1. Badre D, Wagner AD. Computational and neurobiological mechanisms underlying cognitive flexibility. Proceedings of the National Academy of Sciences U. S. A. 2006;103:7186–7191. - PMC - PubMed
    1. Bilder RM, Volavka J, Lachman HM, Grace AA. The catechol-O-methyltransferase polymorphism: Relations to the tonic-phasic dopamine hypothesis and neuropsychiatric phenotypes. Neuropsychopharmacology. 2004;29:1943–1961. - PubMed

Publication types