Meta-Analysis
. 2011 May 13;88(5):586-98.
doi: 10.1016/j.ajhg.2011.04.014.

Random-effects model aimed at discovering associations in meta-analysis of genome-wide association studies

Affiliations
Meta-Analysis

Random-effects model aimed at discovering associations in meta-analysis of genome-wide association studies

Buhm Han et al. Am J Hum Genet. .

Abstract

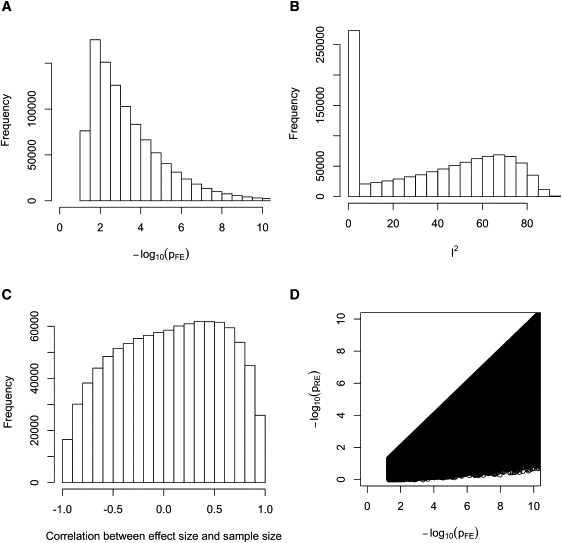
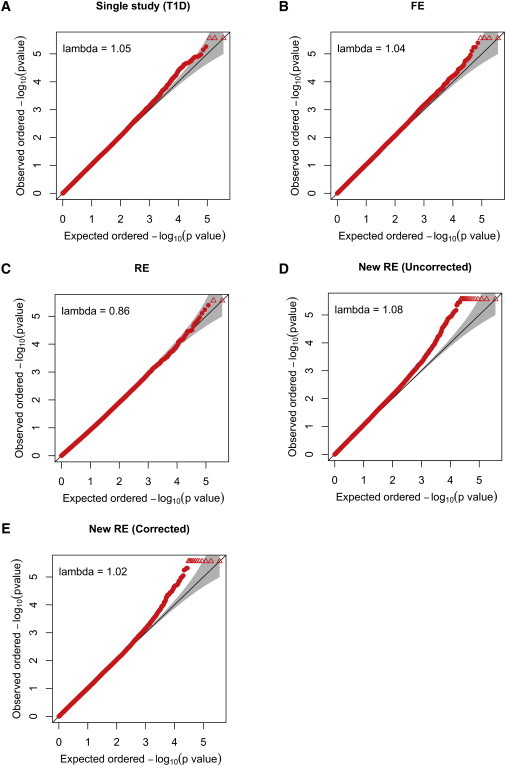
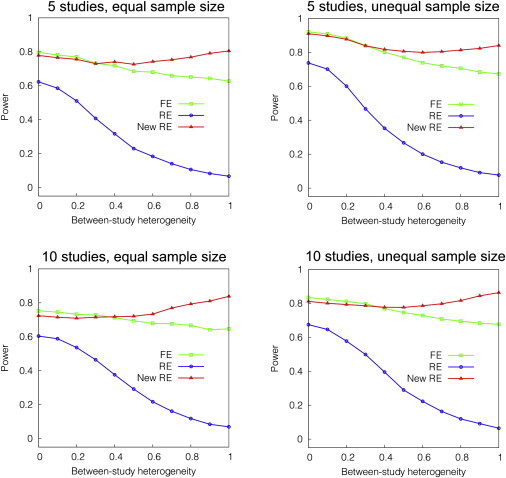
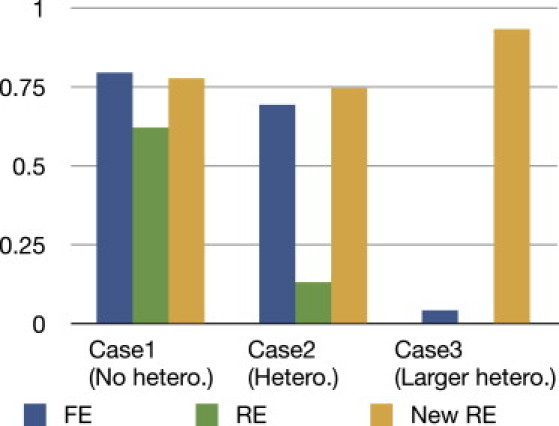
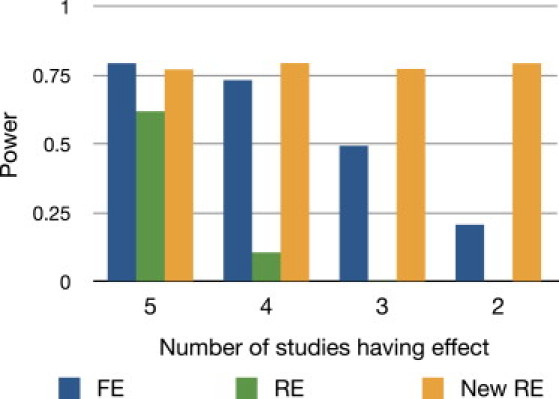
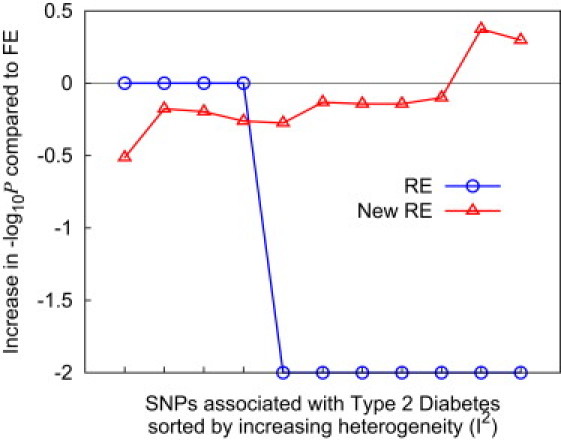
Meta-analysis is an increasingly popular tool for combining multiple different genome-wide association studies (GWASs) in a single aggregate analysis in order to identify associations with very small effect sizes. Because the data of a meta-analysis can be heterogeneous, referring to the differences in effect sizes between the collected studies, what is often done in the literature is to apply both the fixed-effects model (FE) under an assumption of the same effect size between studies and the random-effects model (RE) under an assumption of varying effect size between studies. However, surprisingly, RE gives less significant p values than FE at variants that actually show varying effect sizes between studies. This is ironic because RE is designed specifically for the case in which there is heterogeneity. As a result, usually, RE does not discover any associations that FE did not discover. In this paper, we show that the underlying reason for this phenomenon is that RE implicitly assumes a markedly conservative null-hypothesis model, and we present a new random-effects model that relaxes the conservative assumption. Unlike the traditional RE, the new method is shown to achieve higher statistical power than FE when there is heterogeneity, indicating that the new method has practical utility for discovering associations in the meta-analysis of GWASs.


Figures

Figure 1
Figure 1
Our One Million Trial Simulations Comparing p Values of FE and RE We assume five studies of sample sizes of 400, 800, 1200, 1600, and 2000. (A), (B), and (C) show that our simulations cover a wide range of p values (pFE), heterogeneity (I2), and correlations between the effect size and sample size, respectively. (D) shows that RE never gives a more significant p value than FE in our simulations.
Figure 2
Figure 2
QQ Plot of Various Methods in the Simulated GWAS Meta-Analysis Involving the WTCCC Data Lambda denotes the genomic control inflation factor.
Figure 3
Figure 3
Power of FE, RE, and Our New RE Method in a Simulation Varying Between-Study Heterogeneity We simulate various settings of the number of studies and sample size. The x axis denotes heterogeneity k, where we simulate the standard deviation of the effect size (log odds ratio) to be k times the effect size. We assume the mean odds ratio of 1.3 for five studies and 1.2 for ten studies. When we assume equal sample sizes, we use the sample size of 1000. When we assume unequal sample sizes, we use the sample sizes of 400, 800, …, 2000 for five studies and 200, 400, …, 2000 for ten studies.
Figure 4
Figure 4
Power of FE, RE, and Our New RE Method when the LD Structures Are Different between Studies The LD patterns that we assume for each case are described in Table 5. We assume an odds ratio of 1.3, 1.5, and 1.7 for cases 1, 2, and 3, respectively. We assume equal sample sizes of 1000 for five studies.
Figure 5
Figure 5
Power of FE, RE, and Our New RE when the Number of Studies Having an Effect Varies We assume five studies and gradually decrease the number of studies having an effect from five to two. We assume equal sample sizes of 1000. We increase the odds ratio as the number of studies decreases to show the relative performance between methods.
Figure 6
Figure 6
The Performance of RE and Our New RE in the Real Dataset of Type 2 Diabetes The relative gain in statistical significance relative to FE is plotted for each method. We use the meta-analysis data of Scott et al.

References

    1. Hardy J., Singleton A. Genomewide association studies and human disease. N. Engl. J. Med. 2009;360:1759–1768. - PMC - PubMed
    1. Manolio T.A., Collins F.S., Cox N.J., Goldstein D.B., Hindorff L.A., Hunter D.J., McCarthy M.I., Ramos E.M., Cardon L.R., Chakravarti A. Finding the missing heritability of complex diseases. Nature. 2009;461:747–753. - PMC - PubMed
    1. McCarthy M.I., Abecasis G.R., Cardon L.R., Goldstein D.B., Little J., Ioannidis J.P.A., Hirschhorn J.N. Genome-wide association studies for complex traits: Consensus, uncertainty and challenges. Nat. Rev. Genet. 2008;9:356–369. - PubMed
    1. de Bakker P.I.W., Ferreira M.A.R., Jia X., Neale B.M., Raychaudhuri S., Voight B.F. Practical aspects of imputation-driven meta-analysis of genome-wide association studies. Hum. Mol. Genet. 2008;17(R2):R122–R128. - PMC - PubMed
    1. Zeggini E., Ioannidis J.P.A. Meta-analysis in genome-wide association studies. Pharmacogenomics. 2009;10:191–201. - PMC - PubMed

Publication types