. 2011 May 27;34(5):769-80.
doi: 10.1016/j.immuni.2011.04.013. Epub 2011 May 12.

The Nod2 sensor promotes intestinal pathogen eradication via the chemokine CCL2-dependent recruitment of inflammatory monocytes

Affiliations

The Nod2 sensor promotes intestinal pathogen eradication via the chemokine CCL2-dependent recruitment of inflammatory monocytes

Yun-Gi Kim et al. Immunity. .

Abstract

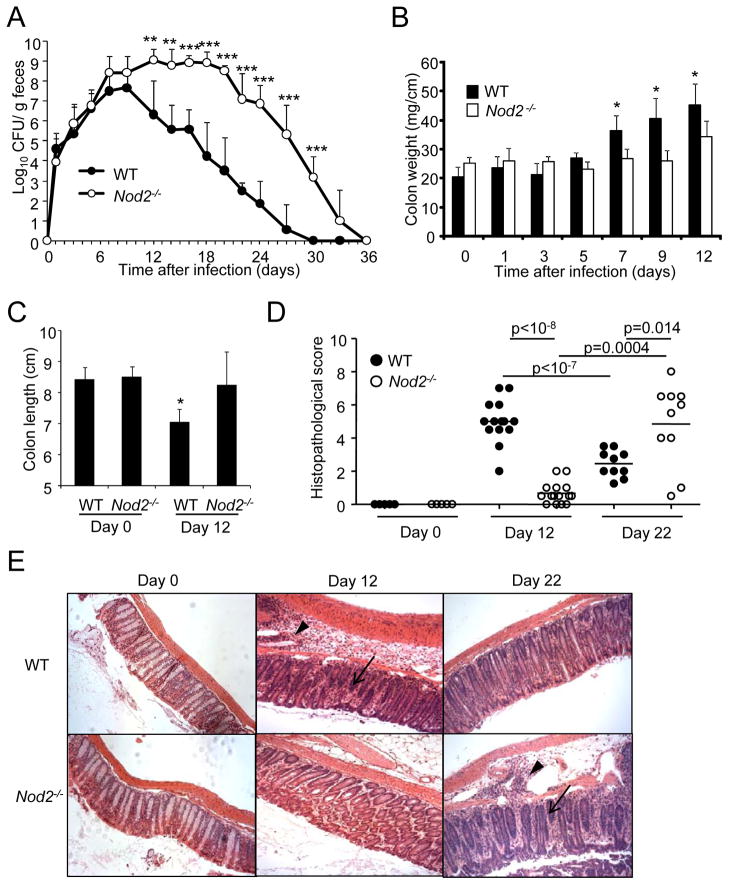
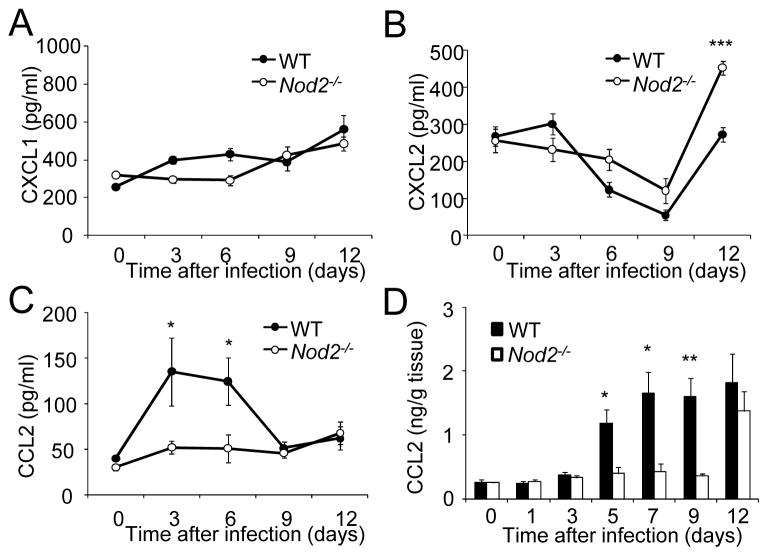
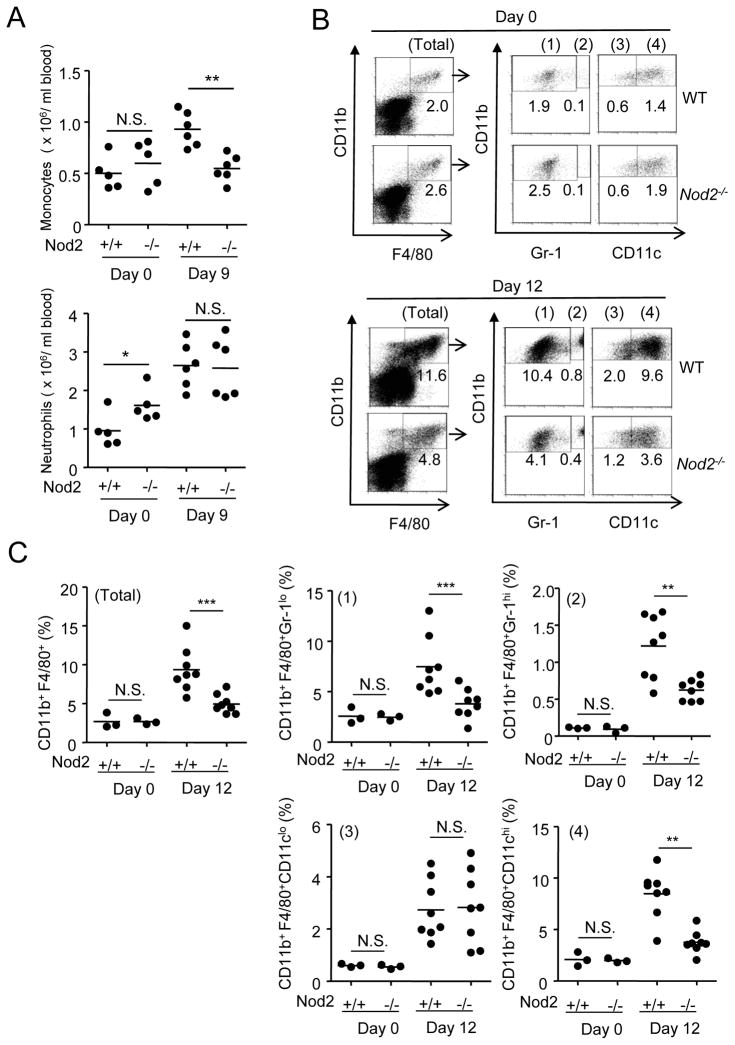
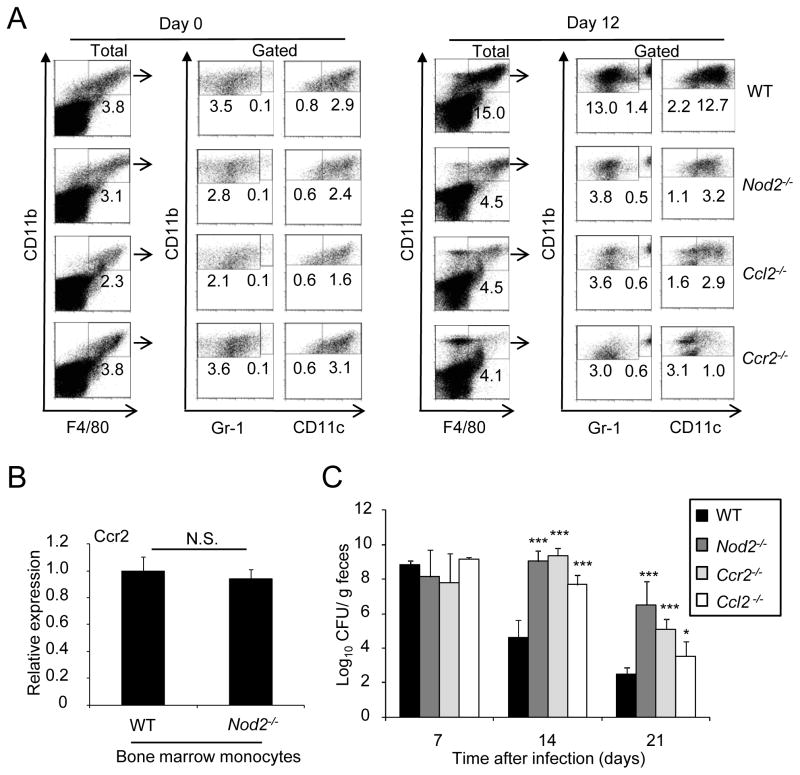
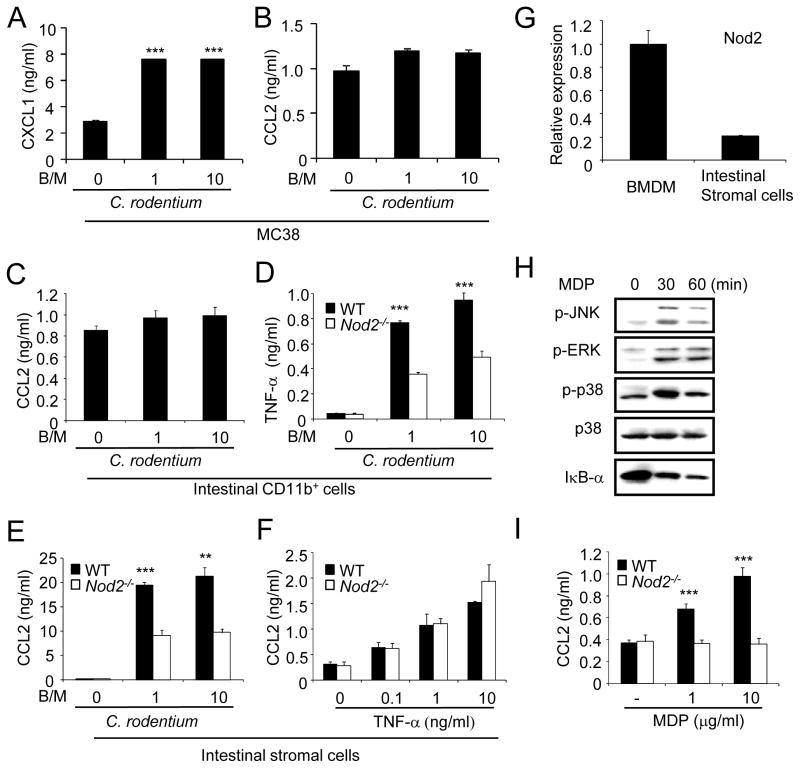
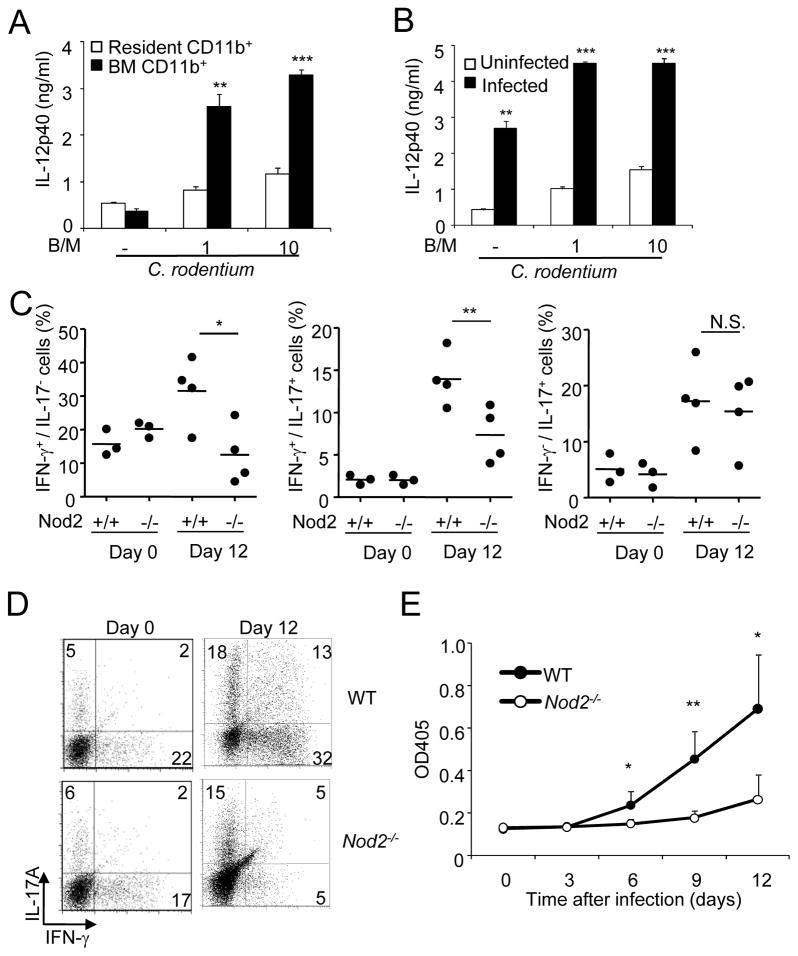
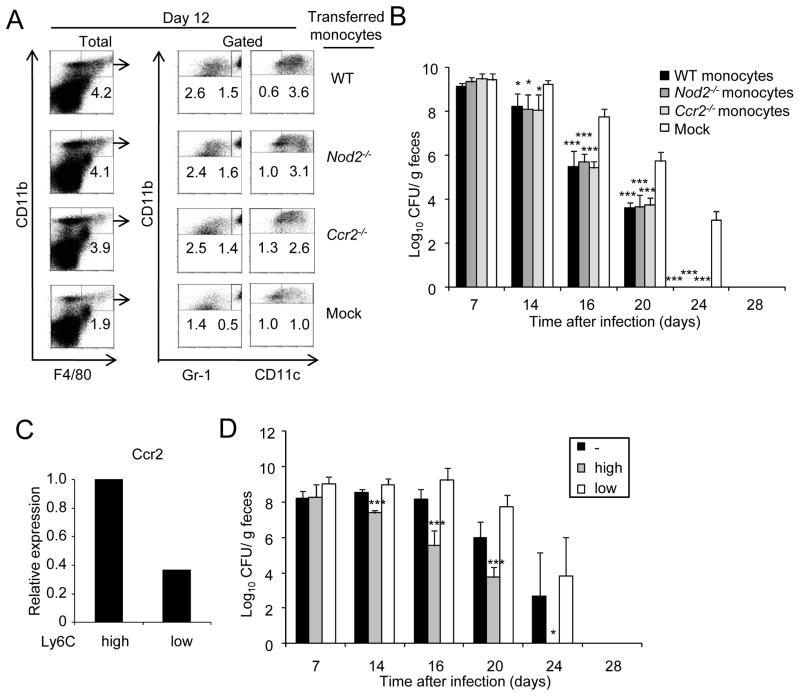
The intracellular sensor Nod2 is activated in response to bacteria, and the impairment of this response is linked to Crohn's disease. However, the function of Nod2 in host defense remains poorly understood. We found that Nod2-/- mice exhibited impaired intestinal clearance of Citrobacter rodentium, an enteric bacterium that models human infection by pathogenic Escherichia coli. The increased bacterial burden was preceded by reduced CCL2 chemokine production, inflammatory monocyte recruitment, and Th1 cell responses in the intestine. Colonic stromal cells, but not epithelial cells or resident CD11b+ phagocytic cells, produced CCL2 in response to C. rodentium in a Nod2-dependent manner. Unlike resident phagocytic cells, inflammatory monocytes produced IL-12, a cytokine that induces adaptive immunity required for pathogen clearance. Adoptive transfer of Ly6C(hi) monocytes restored the clearance of the pathogen in infected Ccr2-/- mice. Thus, Nod2 mediates CCL2-CCR2-dependent recruitment of inflammatory monocytes, which is important in promoting bacterial eradication in the intestine.


Conflict of interest statement

The authors declare that they have no competing financial interests.

Figures

Figure 1
Figure 1. Nod2−/− exhibit impaired clearance of C. rodentium
(A) Bacterial numbers in stool from WT (n= 10) or Nod2−/− mice (n= 10) infected orally with C. rodentium were determined by CFU assay. (B) Colon weight of uninfected wild-type (WT) or Nod2−/− mice, and infected WT (n=10) or Nod2−/− mice (n=10) at days 1, 3, 5, 7, 9, or 12 post-infection (p.i.). (C) Colon length of uninfected WT (n=10) or Nod2−/− mice (n=10), and infected WT (n=10) or Nod2−/− mice (n=10) at day 12 p.i. (D) Histopathological scores of inflammation at day 0 and at day 12 and 22 p. i. of mice inoculated with C. rodentium. Each dot represents an individual mouse. (E) H&E staining of colon slides from representative uninfected and infected WT and Nod2−/− mice. Arrow heads and arrows denote marked submucosal inflammatory cellular infiltrates/edema and epithelial damage/inflammation in the mucosa, respectively. Magnification ×200. Data are means ± SD. *,** and *** denote significant differences between WT and Nod2−/− mice at p<0.05, p<0.01, and P<0.001, respectively. Results are representative of at least 3 independent experiments.
Figure 2
Figure 2. Nod2−/− mice are impaired in their ability to produce CCL2 in response to C. rodentium
Serum CXCL1 (A), CXCL2 (B), and CCL2 (C) levels at day 0, 3, 6, 9, and 12 after infection of WT (n=10) or Nod2−/− mice (n=10) with C. rodentium. (D) CCL2 levels in colon homogenates derived from WT and Nod2−/− mice on day 0, 1, 3, 5, 7, 9, and 12 p. i. with C. rodentium. Data are means ± SE. * and ** denote significant differences between WT and Nod2−/− mice at p<0.05 and p<0.01, respectively. Results are representative of at 2 independent experiments.
Figure 3
Figure 3. Impaired influx of CD11b+Gr1+F4/80+ cells to the colon in Nod2−/− mice infected with C. rodentium
(A) number of monocytes (CD11b+F4/80+Gr-1hi) and neutrophils (CD11b+F4/80Gr-1hi) in the blood of uninfected and infected WT or Nod2−/− mice (n= 5–6 mice per group) at day 9 p.i. (B) Cells were isolated from the colon of WT or Nod2−/− mice on day 0, and 12 after oral infection with C. rodentium, and stained for CD11b, F4/80, and Gr-1 or CD11c mAb. CD11b+F4/80+ double-positive cells (Total fraction) were gated and percentage of CD11b+F4/80+Gr-1lo (1), CD11b+F4/80+Gr-1hi (2), CD11b+F4/80+CD11clo (3), and CD11b+F4/80+CD11chi (4) cells in the gated population was determined. (C) Quantitated data pooled from several experiments; each dot represents one mouse. Horizontal bars indicate mean values. ** and *** denote significant differences between WT and Nod2−/−mice at p<0.01, and P<0.001, respectively. Results are representative of at least 3 independent experiments.
Figure 4
Figure 4. CCL2 and CCR2 regulate the colonic recruitment of CD11b+F4/80+ cells and clearance of C. rodentium
(A) Cells were isolated from the colon of WT, Nod2−/−, Ccl2−/−, or Ccr2−/− mice on day 0, and 12 after oral infection with C. rodentium, and stained for CD11b, F4/80, and Gr-1 or CD11c mAb. CD11b+F4/80+ double-positive cells (% of total cells, left panel) were gated and percentage of CD11b+F4/80+Gr-1lo, CD11b+F4/80+Gr-1hi, CD11b+F4/80+CD11clo, and CD11b+F4/80+CD11chi cells in the gated population was determined. (B) Gene expression of Ccr2 was compared between bone marrow monocytes from WT or Nod2−/− mice by real-time RT-PCR. mRNA expression of Ccr2 was normalized to that of -actin. (C) C. rodentium numbers in stool from infected WT, Nod2−/−, Ccl2−/−, or Ccr2−/− mice (n= 10/group) at indicated time p. i. were determined by CFU assay. Data are means ± SD. * and *** denote significant differences between WT and Nod2−/−, Ccl2−/−, or Ccr2−/− mice at p<0.05 and P<0.001, respectively. Results are representative of at least 3 independent experiments.
Figure 5
Figure 5. Nod2−/− intestinal stromal cells are impaired in CCL2 production. robust amounts of CCL2 in response to C. rodentium which is impaired in Nod2−/− mice
(A, B) MC38 epithelial cells were infected with live C. rodentium at bacterial/macrophage ratio (B/M) of 0 (uninfected), 1, or 10. Cell-free supernatants were analyzed by ELISA for production of CXCL1 (A) and CCL2 (B). *** denotes significant differences between uninfected and C. rodentium-infected cultures at p<0.001. (C) Purified intestinal CD11b+ cells from the colon were infected with C. rodentium at B/M of 0, 1, or 10. Cell-free supernatants were analyzed by ELISA for production of CCL2. (D) Intestinal CD11b+ cells from the colons of WT or Nod2−/− mice were infected with C. rodentium at B/M of 0, 1, or 10. Cell-free supernatants were analyzed by ELISA for production of TNF-α. (E) Colonic stromal cells (Intestinal stromal cells) from WT or Nod2−/− mice were treated with TNF- α at concentration of 0, 0.1, 1, or 10 ng/ml. (F) Intestinal stromal cells from WT or Nod2−/− mice were infected with C. rodentium at the indicated B/M. (G) Nod2 gene expression in bone marrow-derived macrophages and intestinal stromal cells by real-time RT-PCR. mRNA expression of Nod2 was normalized to that of -actin. (H) Intestinal stromal cells were left untreated or stimulated with MDP (10 g/ml) for the indicated times. Cell extracts were immunoblotted with Abs that detect total and phosphorylated (activated) forms of the indicated proteins. (I) Intestinal stromal cells were stimulated with MDP or left untreated for 24 h. Data are means ± SD. **, and *** denote significant differences between cell cultures from WT and Nod2−/− mice at p<0.01, or p<0.001, respectively. Results are representative of at least 3 independent experiments.
Figure 6
Figure 6. Impaired colonic Th1 responses and antibody production against C. rodentium in Nod2−/− mice
(A) Colonic (resident) and bone marrow CD11b+ cells from WT mice were infected with C. rodentium at a bacterial/macrophage ratio (B/M) of 0, 1, or 10. Cell-free supernatants were analyzed by ELISA for production of IL-12p40. ** and ***, denote significant differences between cell cultures from WT and Nod2−/− mice infected with C. rodentium at p<0.01, or p<0.001, respectively. (B) CD11b+ cells purified from the colon of uninfected mice or mice inoculated with C. rodentium for 12 days were infected with C. rodentium at indicated B/M. Cell-free supernatants were analyzed by ELISA for production of IL-12p40. ** and ***, denote significant differences between cell cultures from uninfected and infected with C. rodentium at p<0.01, or p<0.001, respectively. (C) Intracellular production of IFN-γ, and IL-17A was assessed in isolated colonic CD4+ T cells from WT or Nod2−/− mice on day 0 and 12 after oral infection with C. rodentium. Each dot represents one mouse and horizontal bars indicate the mean values. (D) Raw data from representative experiment used to generate results in C. Numbers indicate the percentage of cells in each quadrant. (E) Serum levels of C. rodentium-specific IgG response (mean OD plus SD) in samples from WT or Nod2−/− mice infected with C. rodentium on day 0, 3, 6, 9, and 12. Data are means ± SD. Results are representative of at least 3 independent experiments.
Figure 7
Figure 7. Ly6Chi but not Ly6Clo monocytes promote clearance of C. rodentium.
(A) Bone marrow monocytes from WT, Nod2−/−, and Ccr2−/− mice were adoptively transferred into Ccr2−/− mice previously challenged orally with C. rodentium. Four days after oral infection with C. rodentium, mice received the cells or received PBS (mock) by i.v. injection. Cells were isolated from the colon of WT monocytes → Ccr2−/− mice, Nod2−/− monocytes → Ccr2−/− mice, Ccr2−/− monocytes → Ccr2−/− mice or received no monocytes (mock) on day 0, and 12 after oral infection with C. rodentium. Intestinal cells were stained for CD11b, F4/80, and Gr-1 or CD11c. CD11b+F4/80+ double-positive cells (% of total cells, left panel) were gated and percentage of CD11b+F4/80+Gr-1lo, CD11b+F4/80+Gr-1hi, CD11b+F4/80+CD11clo, and CD11b+F4/80+CD11chi cells in the gated population was determined. Results are representative of at least two experiments. (B) C. rodentium numbers in stool from infected WT monocytes → Ccr2−/− mice, Nod2−/− monocytes → Ccr2−/− mice, Ccr2−/− monocytes → Ccr2−/− mice or mock → Ccr2−/− mice were determined by CFU assay. (C) Expression of Ccr2 in bone marrow Ly6Chi or Ly6Clo monocytes by real-time RT-PCR. mRNA expression of Ccr2 was normalized to that of β-actin. (D) C. rodentium numbers in stool from infected Ly6Chi monocytes → Ccr2−/− mice, Ly6Clo monocytes → Ccr2−/− mice, or mock → Ccr2−/− mice were determined by CFU assay (n= 5 mice per group). Data are means ± SD. Results are representative of 2 independent experiments.

Comment in

References

    1. Auffray C, Fogg D, Garfa M, Elain G, Join-Lambert O, Kayal S, Sarnacki S, Cumano A, Lauvau G, Geissmann F. Monitoring of blood vessels and tissues by a population of monocytes with patrolling behavior. Science. 2007;317:666–670. - PubMed
    1. Biswas A, Liu YJ, Hao L, Mizoguchi A, Salzman NH, Bevins CL, Kobayashi KS. Induction and rescue of Nod2-dependent Th1-driven granulomatous inflammation of the ileum. Proc Natl Acad Sci U S A. 2010;107:14739–14744. - PMC - PubMed
    1. Bogunovic M, Ginhoux F, Helft J, Shang L, Hashimoto D, Greter M, Liu K, Jakubzick C, Ingersoll MA, Leboeuf M, et al. Origin of the lamina propria dendritic cell network. Immunity. 2009;31:513–525. - PMC - PubMed
    1. Borenshtein D, McBee ME, Schauer DB. Utility of the Citrobacter rodentium infection model in laboratory mice. Curr Opin Gastroenterol. 2008;24:32–37. - PubMed
    1. Bry L, Brenner MB. Critical role of T cell-dependent serum antibody, but not the gut-associated lymphoid tissue, for surviving acute mucosal infection with Citrobacter rodentium, an attaching and effacing pathogen. J Immunol. 2004;172:433–441. - PubMed

Publication types