. 2011 May 13;145(4):513-28.
doi: 10.1016/j.cell.2011.04.019.

Mapping the NPHP-JBTS-MKS protein network reveals ciliopathy disease genes and pathways

Affiliations

Mapping the NPHP-JBTS-MKS protein network reveals ciliopathy disease genes and pathways

Liyun Sang et al. Cell. .

Abstract

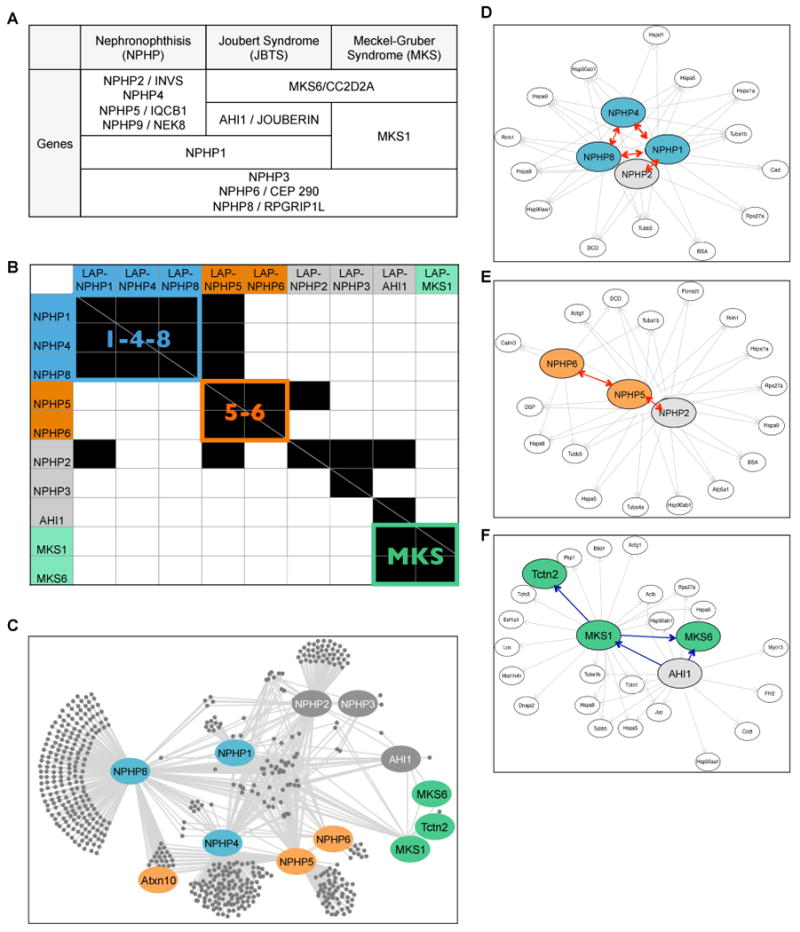
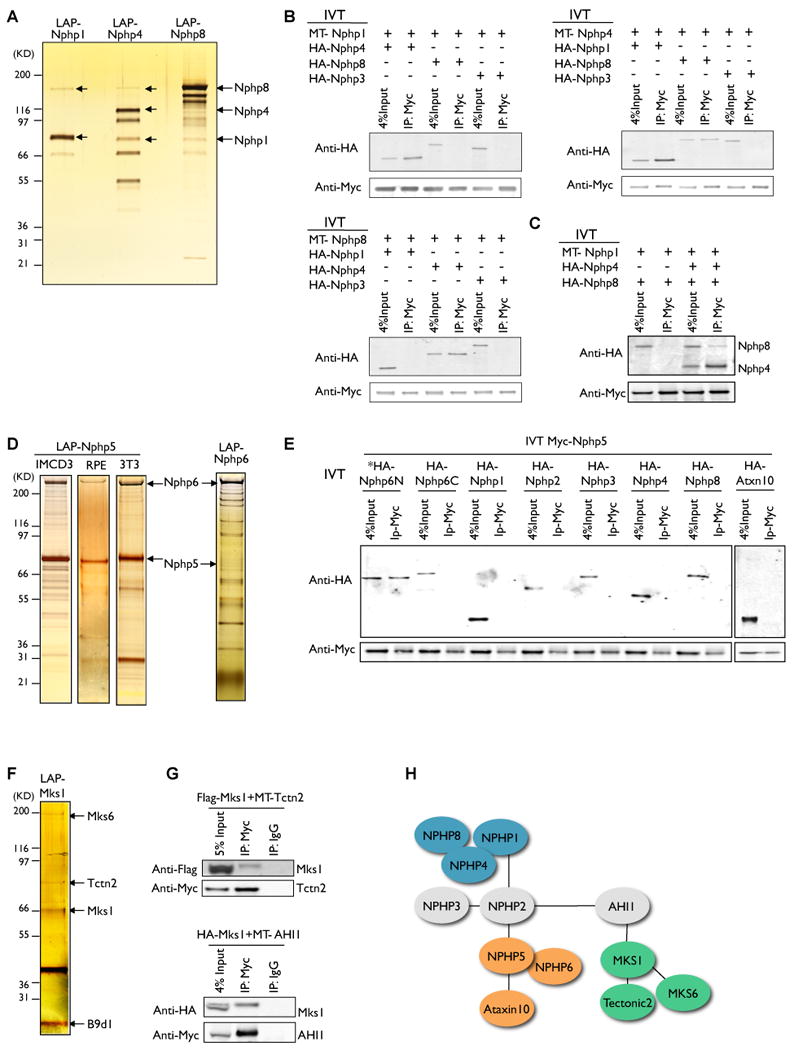
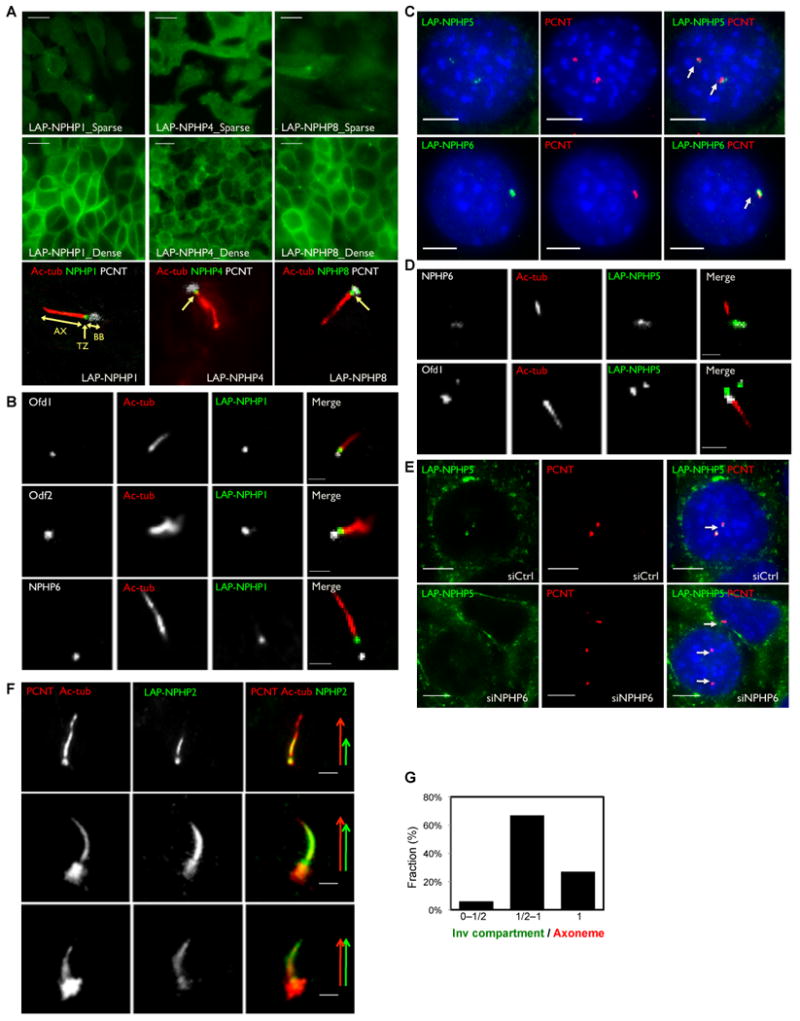
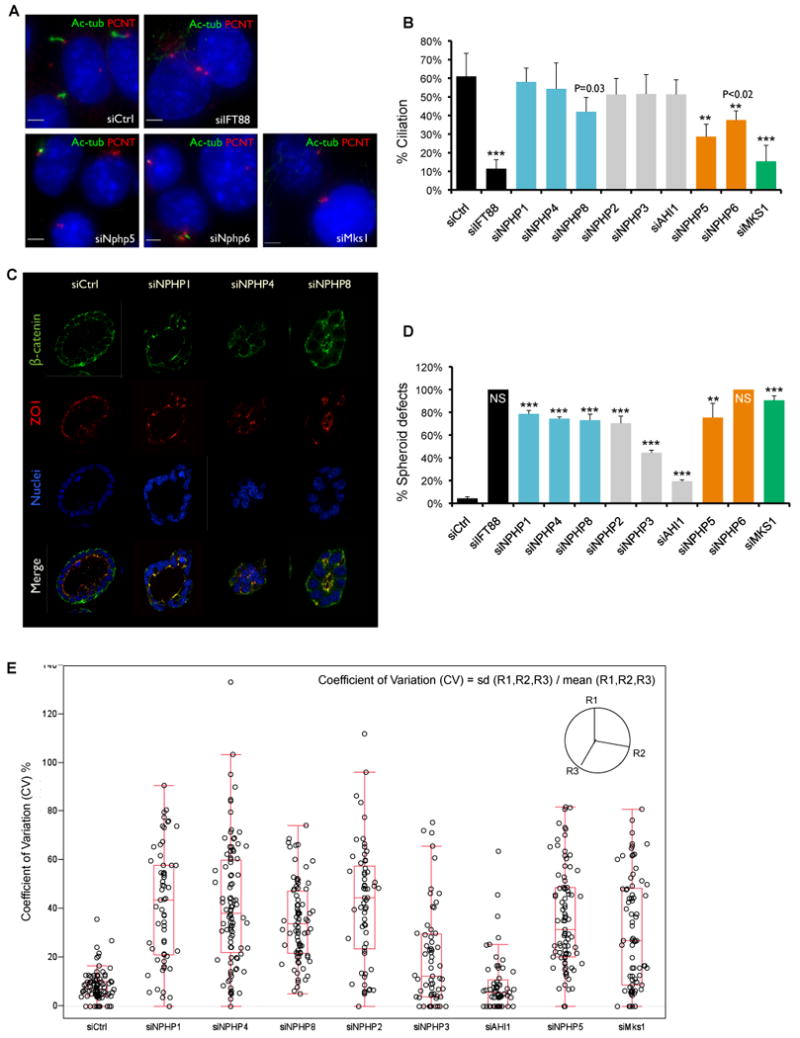
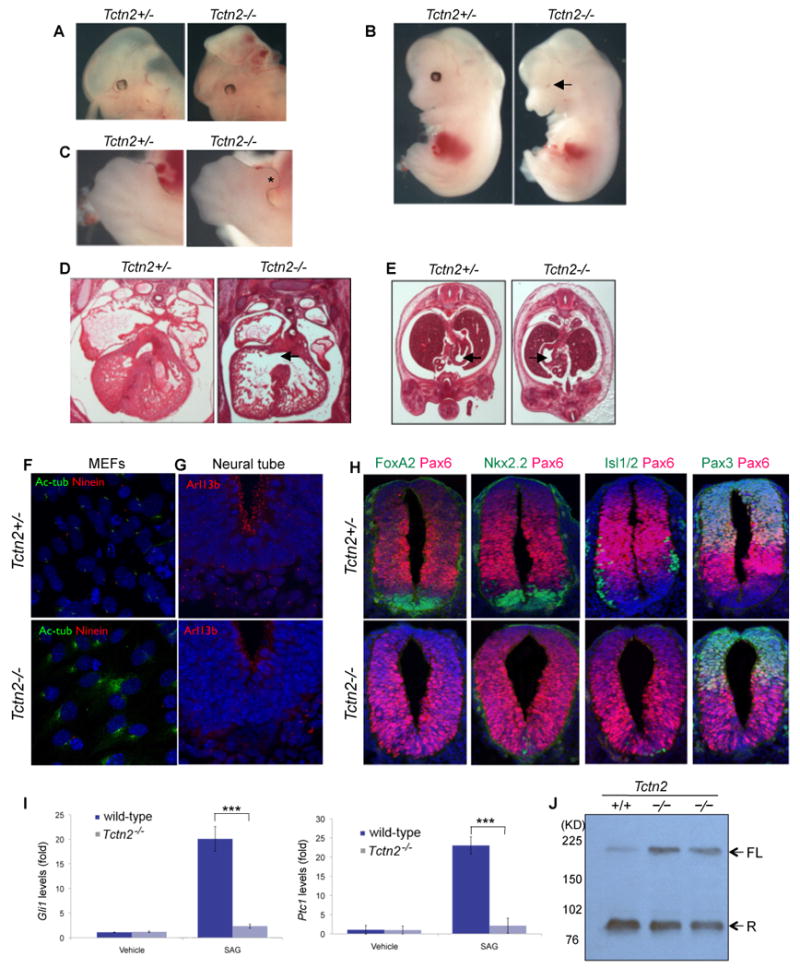
Nephronophthisis (NPHP), Joubert (JBTS), and Meckel-Gruber (MKS) syndromes are autosomal-recessive ciliopathies presenting with cystic kidneys, retinal degeneration, and cerebellar/neural tube malformation. Whether defects in kidney, retinal, or neural disease primarily involve ciliary, Hedgehog, or cell polarity pathways remains unclear. Using high-confidence proteomics, we identified 850 interactors copurifying with nine NPHP/JBTS/MKS proteins and discovered three connected modules: "NPHP1-4-8" functioning at the apical surface, "NPHP5-6" at centrosomes, and "MKS" linked to Hedgehog signaling. Assays for ciliogenesis and epithelial morphogenesis in 3D renal cultures link renal cystic disease to apical organization defects, whereas ciliary and Hedgehog pathway defects lead to retinal or neural deficits. Using 38 interactors as candidates, linkage and sequencing analysis of 250 patients identified ATXN10 and TCTN2 as new NPHP-JBTS genes, and our Tctn2 mouse knockout shows neural tube and Hedgehog signaling defects. Our study further illustrates the power of linking proteomic networks and human genetics to uncover critical disease pathways.


Figures

Figure 1
Figure 1. Mapping the NPHP-JBTS-MKS disease protein network using G-LAP-Flp strategy (see also Figures S1 and S2; Tables S1-3; Table S5; Supplemental Bioinformatics Tools)
A. List of genes mutated in NPHP-JBTS-MKS ciliopathies. B. Heat map summarizing MS/MS interactions among NPHP proteins discovered using G-LAP-Flp strategy. Horizontal axis = LAP-tagged “bait” proteins; vertical axis = interacting proteins. Identified interactions are shown in black. The NPHP1-4-8 (“1-4-8”), NPHP5-6 (“5-6”) and MKS modules are color coded in blue, orange and green. C-F. The NPHP-JBTS-MKS interaction network generated from the R script and visualized using Cytoscape. The entire network is shown in C; individual subgraphs that illustrate the “1-4-8” (IMCD3), “5-6” (IMCD3), and “MKS” (NIH 3T3) modules are shown in D, E, and F. Ellipse = protein; single headed arrows = unreciprocated interactions (pointing to the hits); double headed arrows (red) = reciprocal interactions. Bait proteins and a subset of interactors are highlighted using the color scheme described in Figure 1B.
Figure 2
Figure 2. Validation of NPHP-JBTS-MKS interactions using co-immunoprecipitation and in vitro binding assays (see also Figure S3)
A. LAP-NPHP1, LAP-NPHP4 and LAP-NPHP8 were immunopurified from IMCD3 cells using anti-GFP antibody beads, eluted with TEV protease and recaptured on S-protein agarose. Eluates were separated on 4-12% SDS-polyacrylamide gradient gels and visualized by silver staining. NPHP1, NPHP4 and NPHP8 species are noted by arrows. B-C. NPHP4 bridges the interaction between NPHP1 and NPHP8 in vitro. Myc (MT)-tagged and HA-tagged NPHP1, NPHP4 and NPHP8 were in vitro translated using cell-free wheat germ extract. Each Myc-tagged protein was incubated with HA-tagged protein (s) and immunoprecipitated using anti-Myc beads. Eluates were separated by SDS-PAGE and immunoblotted with an anti-HA antibody. HA-NPHP3 was used as a negative control. D. LAP-NPHP5 complexes were immunopurified from IMCD3 (left), RPE (middle) and NIH 3T3 (right) cells, and LAP-NPHP6 complexes were immunopurified from IMCD3 cells as described in Figure 2A. Identified NPHP5 and NPHP6 species are noted by arrows. E. Interactions between NPHP5 and its associated proteins in vitro. Myc-tagged NPHP5 and HA-tagged interactors were in vitro translated and tested for direct binding using the procedure described above. NPHP5 binds directly to NPHP6 via its N-terminal domain (NPHP6N). F. LAP-MKS1 complexes were immunopurified from NIH 3T3 cells using the procedure described in Figure 2A. Identified Mks1, B9d1, Tctn2 and Mks6 species are noted by arrows. G. Validation of the interactions between Mks1 and copurified proteins Tctn2 and Ahi1. Myc-tagged Tctn2 or Ahi1 were coexpressed with Flag- or HA-tagged Mks1 in HEK293T cells and immunoprecipitated using anti-Myc beads or control IgG beads. Eluates were separated by SDS-PAGE and immunoblotted with an anti-Flag or anti-HA antibody. H. Cartoon summarizing the interactions among NPHP-JBTS-MKS proteins. Ellipse = protein, black line = interaction identified by MS/MS, touching ellipses = direct interactions validated by in vitro binding. NPHP1-4-8, NPHP5-6 and MKS modules are highlighted in blue, orange and green.
Figure 3
Figure 3. Localization of NPHP “1-4-8”, NPHP “5-6” and NPHP2 to the ciliary transition zone, centrosome and the inversin compartment (see also Figure S4)
A. IMCD3 cells stably expressing LAP-NPHP1 (green), LAP-NPHP4 (green) or LAP-NPHP8 (green) were immunostained for pericentrin (PCNT, white) and acetylated α-tubulin (ac-tub, red). AX: Axoneme; TZ: Transition Zone; BB: Basal Body. B. IMCD3 cells stably expressing LAP-NPHP1 (green) were immunostained for acetylated α-tubulin (ac-tub, red) and Ofd1 (white), Odf2 (white), or NPHP6 (white) C-D. NPHP5 and NPHP6 co-localize to the centrosome. C. IMCD3 cells stably expressing LAP-NPHP5 (green) or LAP-NPHP6 (green) were immunostained for pericentrin (PCNT, red). D. IMCD3 cells stably expressing LAP-NPHP5 (green) were immunostained for acetylated α-tubulin (ac-tub, red) and NPHP6 (white) or Ofd1 (white). E. Centrosomal localization of LAP-NPHP5 is disrupted upon depletion of NPHP6. IMCD3 LAP-NPHP5 (green) cells were transfected with siRNA against NPHP6 or control, and then immunostained for pericentrin (PCNT, red). Nuclei were stained with Hoechst 33258 (blue). F. NPHP5 interacting protein NPHP2 localizes to the centrosome and to the cilium. IMCD3 LAP-NPHP2 cells (green) were immunostained for pericentrin (PCNT, red) and acetylated α-tubulin (ac-tub, red). Arrows exemplify variable NPHP2/Inversin compartment extensions along the axoneme. G. Percentage of cilia with a range of “Inversin compartment / Axoneme” ratios. Scale bars, 10um (A), 5um (C) and (E), 2um (B), (D) and (F).
Figure 4
Figure 4. Functional requirements for ciliation and 3D spheroid formation show distinct activities for the NPHP “1-4-8”, NPHP “5-6”, and MKS modules (see also Figures S4 and S5; Tables S4, S6 and S7)
A. Depletion of NPHP5, NPHP6, and MKS1 causes ciliation defects. IMCD3 cells were transfected with siRNAs against individual disease genes, IFT88, or control. Cells were fixed 72 hrs post-transfection and stained for acetylated α-tubulin (green), pericentrin (red), and DNA dye Hoechst 33528 (blue). Scale bar, 5um. B. Cilia were scored based on positive, adjacent staining of both pericentrin and acetylated α-tubulin. Percentage of nuclei with cilia was plotted (500-700 cells counted). Error bars represent standard error. *** p <0.002; ** p <0.02 (student's t test). C. Depletion of NPHP1, NPHP4 or NPHP8 cause spheroid defects in 3D kidney culture. IMCD3 cells were transferred to 3D collagen/Matrigel culture 24 hour post-transfection. Spheroids were fixed 72 hours later and immunostained for β-catenin (green) and ZO1 (red). Nuclei were stained with Hoechst 33528 (blue). D. Percentage of spheroids with defects. 400 – 700 spheroids counted and error bars represent standard error. NS, “No spheroids formed”, shown as 100% defective. *** p <0.001; ** p <0.01 (student's t test). E. The sphericity of a spheroid was defined using the three radii (R) measurements, which were sampled on each spheroid at 100 degree intervals. The coefficient of variation (CV) was calculated using the formula: CV= standard deviation (R1,R2,R3) / mean (R1,R2,R3). Raw CV data from each knockdown are plotted along with the outlier box plot. Lower quartile = 25th percentile; upper quartile = 75th percentile; top line = upper quartile + 1.5 × interquartile range; bottom line = lower quartile - 1.5 × interquartile range; middle line = 50th percentile; data points outside the lines are outliers.
Figure 5
Figure 5. Identification of ATXN10 and TCTN2 as new NPHP and JBTS disease genes (see also Figure S6)
A. Genotype and phenotype of patients with mutations in ATXN10 and TCTN2. Bx, Biopsy compatible with NPHP; MTS, “molar tooth sign”; NAD, nothing abnormal detected; N/A, clinical data not available. B. RT-PCR was performed in Joubert syndrome patient A1443 using cDNA primers to exons 7 and 14 of TCTN2. Sequencing revealed an in-frame skipping of exon 11. C. MRI images (T1) of Joubert syndrome patients MR20-3 and UW95-3 showing the molar tooth sign (MTS).
Figure 6
Figure 6. Tctn2 is required for ciliogenesis and Hh signaling transduction (see also Figure S7)
A. E13.5 Tctn2-/- embryos on a mixed 129/Bl6 background have fully penetrant cranial exencephaly. On a Bl6 background, E13.5 Tctn2-/- embryos display (B.) microphthalmia (arrow) and (C.) single hindlimb preaxial polydactyly, either bilaterally or unilaterally (asterisk). D. Hematoxylin and eosin staining of E14.5 Tctn2-/- embryos reveals ventricular septal defects (black arrow) and (E.) laterality defects as evidenced by randomized stomach situs. F. Mouse embryonic fibroblasts (MEFs) derived from E12.5 Tctn2+/- embryos are ciliated, whereas Tctn2-/- embryo-derived MEFs rarely generate cilia. Acetylated tubulin (green) marks cilia, Ninein (red) marks basal bodies and centrosomes, DAPI (blue) marks nuclei. G. Immunofluorescent detection of Arl13b (red) in E9.5 transverse neural tube sections indicates that Tctn2-/- embryos display few and abnormal cilia. H. Tctn2 is required for patterning of the ventral neural tube. Immunofluorescence of E9.5 transverse sections between the heart and hind limb stained for Pax6 in red and, in green, FoxA2, Nkx2.2, Islet1/2 or Pax3. I. Levels of the Hh transcriptional targets Gli1 and Ptc1 were assessed by qPCR in MEFs derived from E12.5 Tctn2+/+ and Tctn2-/- littermate embryos stimulated with DMSO (vehicle) or Smoothened agonist (SAG) for 18 hours. Tctn2+/+ MEFs upregulate Gli1 and Ptc1 20-25 fold following SAG addition, whereas Tctn2-/- MEFs are unresponsive. Experiments were performed three times in triplicate and values normalized to β-actin and presented as relative levels +/- SEM. *** p < 0.001 (student's t test). J. Lysates from E13.5 Tctn2+/+ and Tctn2-/- littermate embryos immunoblotted for Gli3. In wild-type embryos, the majority of Gli3 is processed into a truncated repressor form (R). Tctn2 mutants have increased levels of unprocessed full-length (FL) Gli3.
Figure 7
Figure 7. A Model for the NPHP-Joubert-Meckel-Gruber Network
Three interacting modules link centrosomal proteins to apical organization and to a Hedgehog regulatory network.

Similar articles

Cited by

References

    1. Baala L, Audollent S, Martinovic J, Ozilou C, Babron MC, Sivanandamoorthy S, Saunier S, Salomon R, Gonzales M, Rattenberry E, et al. Pleiotropic effects of CEP290 (NPHP6) mutations extend to Meckel syndrome. Am J Hum Genet. 2007;81:170–179. - PMC - PubMed
    1. Benzing T, Gerke P, Hopker K, Hildebrandt F, Kim E, Walz G. Nephrocystin interacts with Pyk2, p130(Cas), and tensin and triggers phosphorylation of Pyk2. Proc Natl Acad Sci U S A. 2001;98:9784–9789. - PMC - PubMed
    1. Bialas NJ, Inglis PN, Li C, Robinson JF, Parker JD, Healey MP, Davis EE, Inglis CD, Toivonen T, Cottell DC, et al. Functional interactions between the ciliopathy-associated Meckel syndrome 1 (MKS1) protein and two novel MKS1-related (MKSR) proteins. J Cell Sci. 2009;122:611–624. - PMC - PubMed
    1. Chang B, Khanna H, Hawes N, Jimeno D, He S, Lillo C, Parapuram SK, Cheng H, Scott A, Hurd RE, et al. In-frame deletion in a novel centrosomal/ciliary protein CEP290/NPHP6 perturbs its interaction with RPGR and results in early-onset retinal degeneration in the rd16 mouse. Hum Mol Genet. 2006;15:1847–1857. - PMC - PubMed
    1. Corbit KC, Aanstad P, Singla V, Norman AR, Stainier DY, Reiter JF. Vertebrate Smoothened functions at the primary cilium. Nature. 2005;437:1018–1021. - PubMed

Publication types

Supplementary concepts