. 2011 May 13;145(4):571-83.
doi: 10.1016/j.cell.2011.03.035.

Distinct p53 transcriptional programs dictate acute DNA-damage responses and tumor suppression

Affiliations

Distinct p53 transcriptional programs dictate acute DNA-damage responses and tumor suppression

Colleen A Brady et al. Cell. .

Abstract

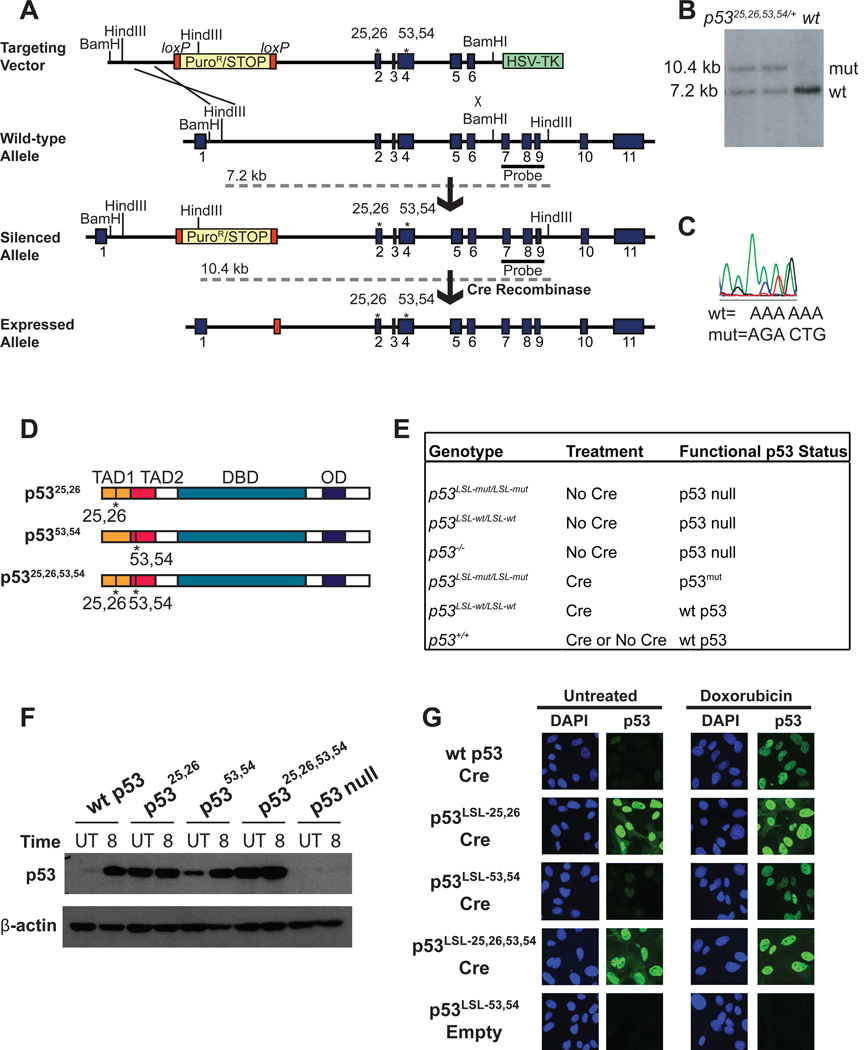
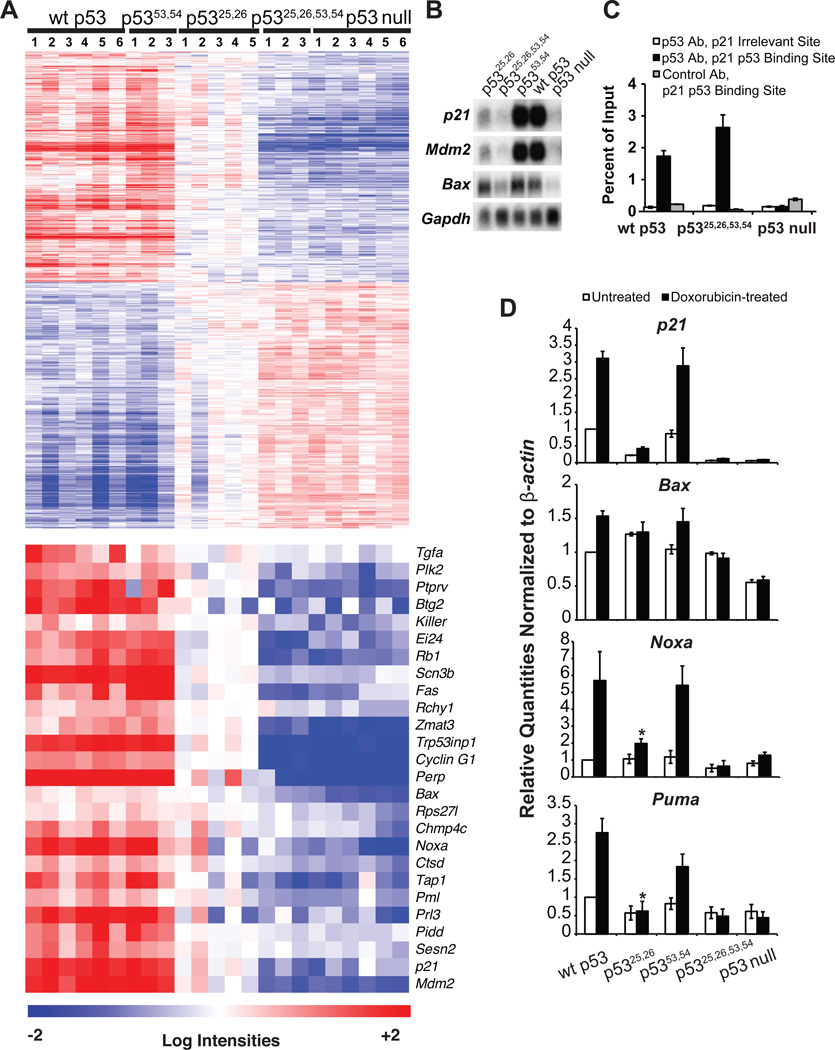
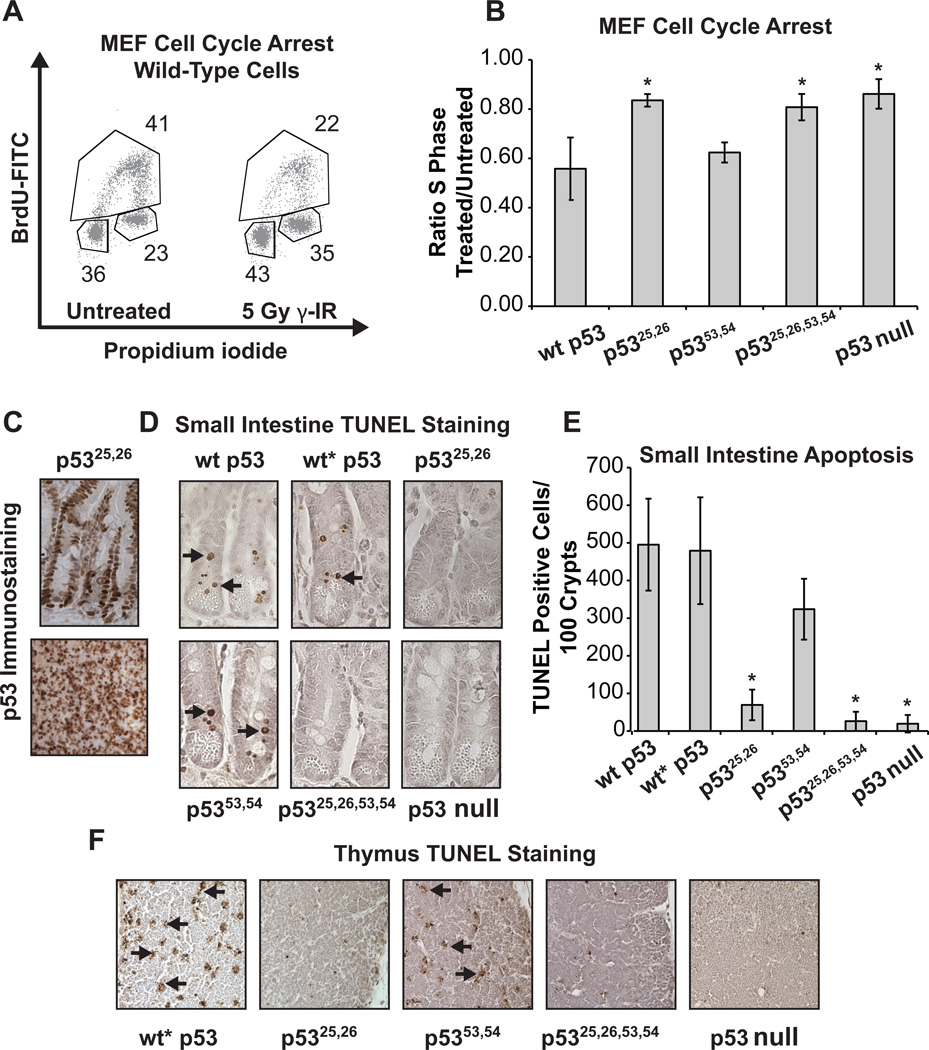
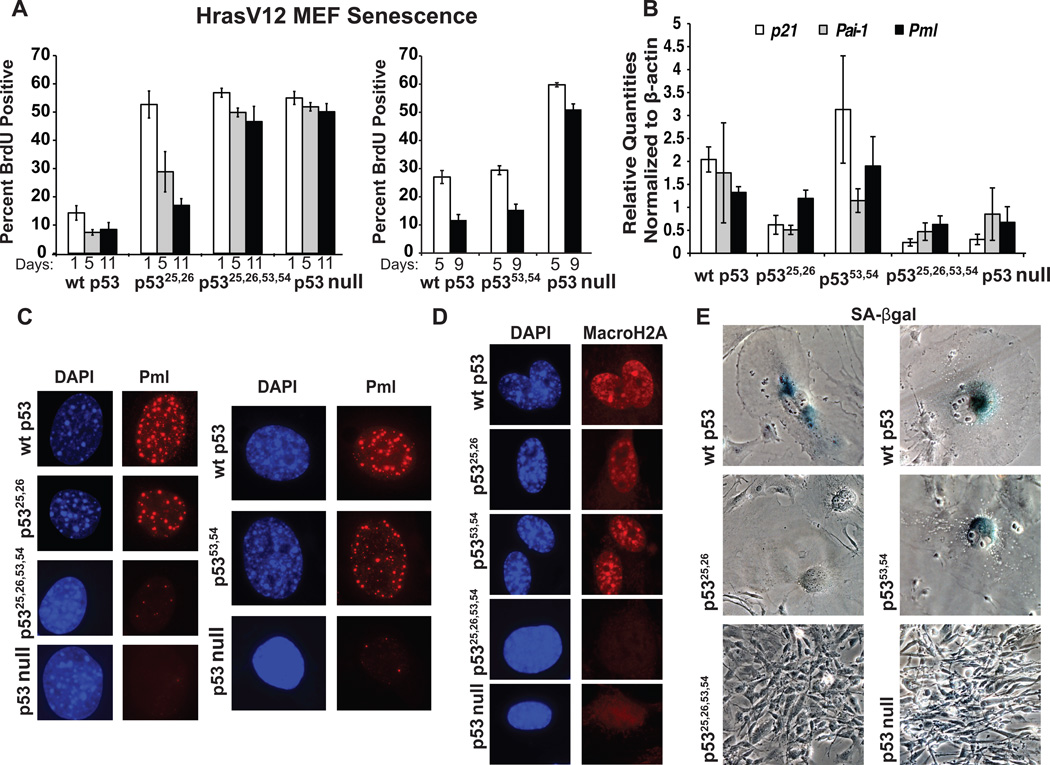
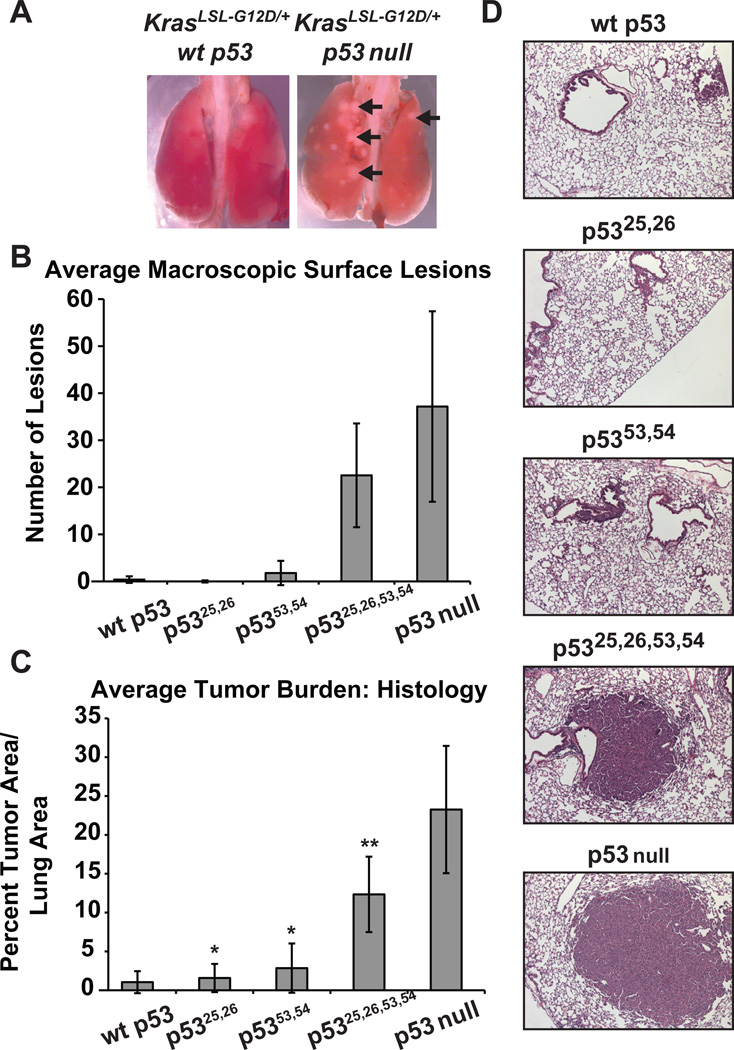
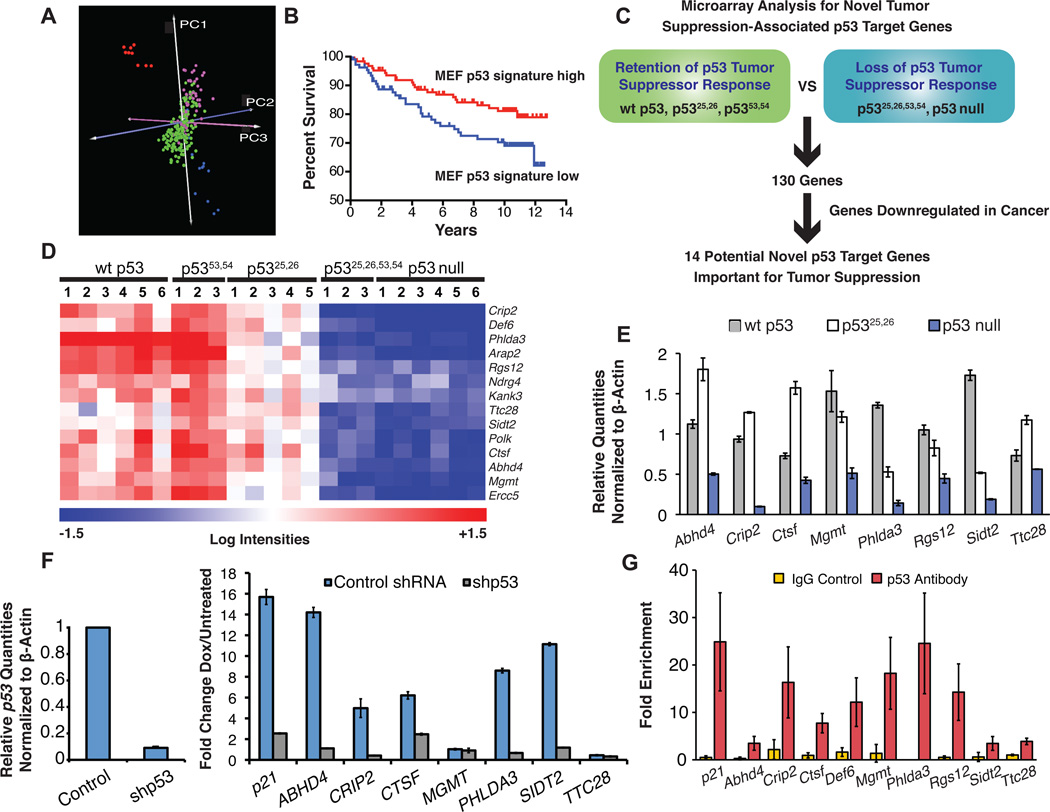
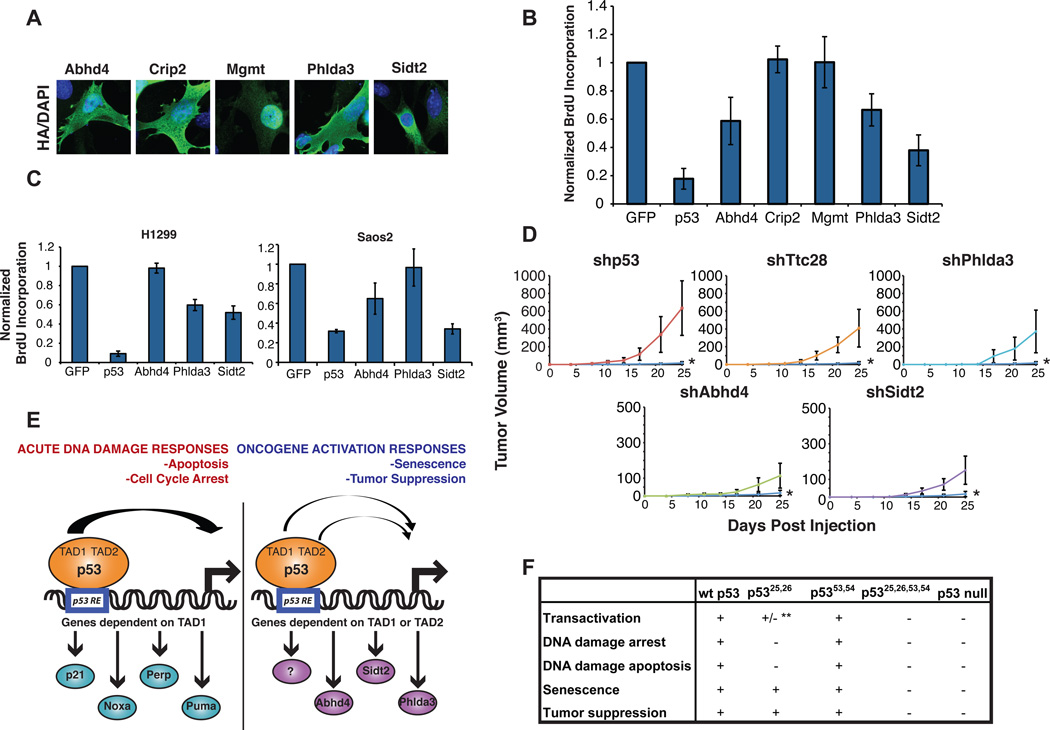
The molecular basis for p53-mediated tumor suppression remains unclear. Here, to elucidate mechanisms of p53 tumor suppression, we use knockin mice expressing an allelic series of p53 transcriptional activation mutants. Microarray analysis reveals that one mutant, p53(25,26), is severely compromised for transactivation of most p53 target genes, and, moreover, p53(25,26) cannot induce G(1)-arrest or apoptosis in response to acute DNA damage. Surprisingly, p53(25,26) retains robust activity in senescence and tumor suppression, indicating that efficient transactivation of the majority of known p53 targets is dispensable for these pathways. In contrast, the transactivation-dead p53(25,26,53,54) mutant cannot induce senescence or inhibit tumorigenesis, like p53 nullizygosity. Thus, p53 transactivation is essential for tumor suppression but, intriguingly, in association with a small set of novel p53 target genes. Together, our studies distinguish the p53 transcriptional programs involved in acute DNA-damage responses and tumor suppression-a critical goal for designing therapeutics that block p53-dependent side effects of chemotherapy without compromising p53 tumor suppression.


Figures

Fig 1
Fig 1. Generation of p53 TAD mutant knock-in mice
(A) Targeting scheme used to generate knock-in mice, with the p5325,26,53,54 mutant as an example. Mutant p53 expression from targeted alleles is silenced until Cre introduction allows for excision of the stop element. Dotted grey lines indicate the sizes of the fragments generated from each allele upon HindIII digestion. (B) Southern blot showing 2 correctly targeted, heterozygous ES cell clones compared to a wild-type cell line. Genomic DNA was digested with HindIII and the Southern blot probed with the 3’ external probe indicated in (A). (C) Sequencing analysis of the reverse complement confirms the presence of point mutations in properly targeted cell lines. (D) Schematic of p5325,26, p5353,54, and p5325,26,53,54 proteins showing the transactivation domains (TADs), DNA binding domain (DBD), and oligomerization domain (OD). (E) Table summarizing the genotype, treatment, and ultimate functional p53 status of samples used throughout the manuscript. LSL-mut denotes any of the Lox-Stop-Lox p53 TAD mutants. (F) Western blot analysis for p53 in wild-type or homozygous p53LSL-mut MEFs transduced with Ad-Cre or Ad-empty (indicated as p53 null), either left untreated (UT) or treated for 8 hrs with 0.2 µg/ml dox (doxorubicin) (8). β-actin served as a loading control. Comparable, high efficiency (>90% of cells) of Cre recombination was confirmed by immunostaining for p53. (G) Immunofluorescence for p53 in wild-type or homozygous p53LSL-mut MEFs transduced with Ad-Cre or Ad-empty. Cells were left untreated (left) or treated with 0.2 µg/ml dox to stabilize p53 (right). Nuclei were stained with DAPI.
Fig. 2
Fig. 2. Analysis of the transcriptional activation potential of the p53 TAD mutants
(A) (Upper) Heat map defining transactivation capacity of p53 TAD mutants using a p53-dependent gene set identified by microarray analysis through comparison of 6 HrasV12;p53 wild-type to 6 HrasV12;p53 null MEF samples. Columns indicate independent MEF lines. (Lower) Heat map examining p53 mutant activity on confirmed, direct p53 target genes (Brady and Attardi, 2010; Riley et al., 2008). (B) Northern blot using RNA samples from (A). (C) ChIP showing that p5325,26,53,54 binds to the p53 response element in the p21 promoter and not to an irrelevant region 3 kb downstream. p16 antibody serves as a negative control. (D) qRT-PCR of RNA from MEFs either untreated (white bars) or treated with 0.2 µg/ml dox for 8 hrs (black bars). Graphs indicate averages +/− SEM of quantities normalized first to β-actin and then to wild-type untreated sample values from 3 independent MEF lines. * indicates non-significant difference of p > 0.05 v. p53 null. See also Figure S1.
Fig. 3
Fig. 3. The first p53 TAD plays the predominant role in acute DNA damage responses
(A) Representative propidium iodide and BrdU flow cytometry data from asynchronous wild-type MEFs showing G1 arrest response after γ-irradiation. (B) Average S-phase ratio of γ-irradiation-treated/untreated MEFs. Wild-type, p53LSL-25,26/LSL-25,26, p53LSL-53,54/LSL-53,54, and p53LSL-25,26,53,54/LSL-25,26,53,54 cells were infected with Ad-Cre or Ad-empty and irradiated. Averages of 3–5 experiments +/− SD are graphed. * indicates a significant difference of p < 0.001 v. p53 wt, one-way ANOVA with Bonferroni post tests. (C) p53 immunostaining in p5325,26-expressing small intestine (top) and thymus (bottom) from Rosa26CreER;p5325,26/25,26 mice treated with tamoxifen. (D) Representative TUNEL-staining images showing apoptotic cells (arrows) in small intestines. Wild-type p53, p53LSL-wt/LSL-wt (wt*), p53LSL-25,26/LSL-25,26, p53LSL-53,54/LSL-53,54, and p53LSL-25,26,53,54/LSL-25,26,53,54 mice carrying the Rosa26CreERT2 allele were treated with tamoxifen and irradiated, then tissues were collected 6 hrs later. Cre-negative mice treated with tamoxifen served as p53 null controls. (E) Average number of TUNEL positive cells per 100 crypts of the small intestine +/− SD from at least 4 mice per genotype. * indicates a significant difference of p < 0.001 v. p53 wt, one-way ANOVA with Bonferroni post tests. (F) Representative TUNEL staining of thymi, with arrows indicating apoptosis.
Fig. 4
Fig. 4. p5325,26, but not p5325,26,53,54, induces cellular senescence in HrasV12 MEFs
(A) Average percentages of BrdU-positive cells over time. Left: HrasV12-expressing p53+/+, p53LSL-25,26/LSL-25,26, and p53LSL-25,26,53,54/LSL-25,26,53,54 MEFs were infected with Ad-Cre and cultured. Total percentages of p53-positive cells displaying BrdU positivity are shown. Right: HrasV12-expressing p53+/+, p5353,54/53,54, and p53LSL-53,54/LSL-53,54 (p53 null) MEFs were cultured and analyzed for BrdU incorporation. The timelines under the graphs denote either days post-Ad-Cre (performed 4 days after HrasV12 transduction; left) or days after HrasV12 transduction (right, where Ad-Cre is not used). Averages +/− SEM of at least 3 cell lines per genotype are graphed. (B) qRT-PCR analysis of the expression of the senescence-related target genes p21, Pai-1, and Pml in HrasV12 MEFs (C) Pml immunostaining of HrasV12 MEFs at the final timepoints of senescence assays. DAPI stains nuclei. (D) MacroH2A staining of HrasV12 MEFs at the final timepoints of senescence assays. DAPI stains nuclei. (E) Phase contrast images of SA-β-galactosidase staining and morphology of HrasV12 MEFs at the final timepoints of senescence assays. See also Figure S2.
Fig. 5
Fig. 5. p5325,26 and p5353,54, but not p5325,26,53,54, are potent tumor suppressors
KrasLSL-G12D/+ mice with p53+/+ (n=9), p53LSL-25,26/LSL-25,26 (n=6), p53LSL-53,54/LSL-53,54 (n=12), p53LSL-25,26,53,54/LSL-25,26,53,54 (n=13), or p53−/− (n=6) status were infected intranasally with Ad-Cre at 6–8 weeks, and lungs were collected 12 weeks later. (A) Whole mount images of lungs from KrasG12D;p53+/+ and KrasG12D;p53−/− mice, with arrows indicating tumors. (B) Average number of macroscopic lung tumors +/− SD in mice of all genotypes. (C) Average tumor burden, calculated as the ratio of total tumor area to total lung area on H&E-stained sections, +/− SD in mice of all genotypes. * indicates no significant difference, p > 0.05 v. p53 wild-type, ** indicates significant difference of p < 0.001 v. p53 wt, one-way ANOVA Bonferroni post tests. (D) Representative histological sections from lungs of each genotype.
Fig. 6
Fig. 6. Microarray analysis to identify p53 targets associated with tumor suppression
(A) Gene expression profiles of HrasV12 MEFs from p53 genotypes that retain wild-type p53 tumor suppressor activity (wt p53, p5353,54/53,54 and p5325,26/25,26) were compared to those lacking p53 tumor suppressor activity (p5325,26,53,54/25,26,53,54 and p53 null). Those genes expressed at least 2-fold and 1.5 standard deviations higher in the wild-type group relative to the p53 null group were used as a p53 signature to predict p53 status of human breast cancer samples by PCA (Miller et al., 2005; Blue= wt p53, p5353,54 and p5325,26 MEFs, red= p5325,26,53,54 and p53 null MEFs, green=p53wt human breast cancers, pink=p53mut human breast cancers). (B) Kaplan-Meier curves demonstrate the effectiveness of MEF p53 signature in stratifying human breast cancer samples by patient survival; p=0.0422, log rank test. (C) Schematic showing approach to identify p53 target genes potentially involved in tumor suppression. (D) Heat map displaying the 14 genes meeting the filtering criteria described in (C). (E) qRT-PCR validation showing the average expression levels +/− SD of target genes in HrasV12 MEFs homozygous for wt p53, p5325,26, or p53 null alleles, after normalization to β-actin. (F) Induction of target genes by DNA damage is p53-dependent in GM00011 human fibroblasts. qRT-PCR demonstrates the efficacy of p53 knockdown with p53 shRNA compared to scrambled control shRNA (left) and the p53-dependence of target gene induction after 24 hrs of treatment with 0.2 µg/ml dox (right). Values are the averages of 3 replicates +/− SD. (G) ChIP for p53 binding to consensus sites in target genes in wild-type MEFs treated with 0.2 µg/ml dox for 6 hrs. IgG antibody serves as a negative control. Values represent the fold enrichment of binding to the p53 consensus site compared to binding to an irrelevant gene desert site and are the average of 3 replicates +/− SD. See also Figure S3.
Fig. 7
Fig. 7. Novel p53 target gene products display tumor suppressor activity
(A) Immunofluorescence indicating localization of HA-tagged proteins expressed in HrasV12;p53 null MEFs. (B) Quantification of BrdU labeling in HrasV12;p53 null MEFs expressing different target gene products and BrdU-pulsed 24 hrs post-transfection. The BrdU labeling index of HA-positive cells was assessed by immunofluorescence. Values are normalized to the proliferative index of cells expressing HA-GFP, and p53 is used as a positive control for arrest. Averages +/− SD are shown. (C) Quantification of BrdU labeling in H1299 and Saos2 cells expressing p53 or different target gene products, as described in (B). Averages +/− SEM are shown. (D) Average tumor volumes +/− SEM, as a function of time, in Scid mice injected with E1A-HRasV12 transformed MEFs with knockdown of various genes. shGFP control tumors are indicated by the blue line in each graph and labeled *. (E) Models for p53 action in response to acute DNA damage versus oncogenic signals. p53 responses to acute DNA damage, including apoptosis and cell cycle arrest, rely on the activity of the first p53 TAD and robust transactivation of canonical p53 target genes such as p21, Noxa, Puma, and Perp. In contrast, p53 responses downstream of oncogenic signaling in senescence and tumor suppression can be driven by either p53 TAD. A more limited p53 transactivation program, such as through efficient activation of novel p53 target genes regulated by either the first or second p53 TAD, including Phlda3, Abhd4, and Sidt2, can account for p53 function in these contexts. (F) Table summarizing findings described in this entire study. **indicates minimal transactivation of most, but not all, p53 target genes. See also Figure S4.

Comment in

  • Parsing p53 Transactivation.
    Campisi J. Campisi J. Dev Cell. 2011 May 17;20(5):573-4. doi: 10.1016/j.devcel.2011.04.015. Dev Cell. 2011. PMID: 21571212

Similar articles

Cited by

References

    1. Attardi LD, de Vries A, Jacks T. Activation of the p53-dependent G1 checkpoint response in mouse embryo fibroblasts depends on the specific DNA damage inducer. Oncogene. 2004;23:973–980. - PubMed
    1. Baptiste-Okoh N, Barsotti AM, Prives C. A role for caspase 2 and PIDD in the process of p53-mediated apoptosis. Proceedings of the National Academy of Sciences of the United States of America. 2008;105:1937–1942. - PMC - PubMed
    1. Barboza JA, Liu G, Ju Z, El-Naggar AK, Lozano G. p21 delays tumor onset by preservation of chromosomal stability. Proceedings of the National Academy of Sciences of the United States of America. 2006;103:19842–19847. - PMC - PubMed
    1. Brady CA, Attardi LD. p53 at a glance. J Cell Sci. 2010;123:2527–2532. - PMC - PubMed
    1. Brown JP, Wei W, Sedivy JM. Bypass of senescence after disruption of p21CIP1/WAF1 gene in normal diploid human fibroblasts. Science (New York, NY. 1997;277:831–834. - PubMed

Publication types

Substances

Associated data