. 2011 May 13;145(4):596-606.
doi: 10.1016/j.cell.2011.04.013.

A hormone-dependent module regulating energy balance

Affiliations

A hormone-dependent module regulating energy balance

Biao Wang et al. Cell. .

Abstract

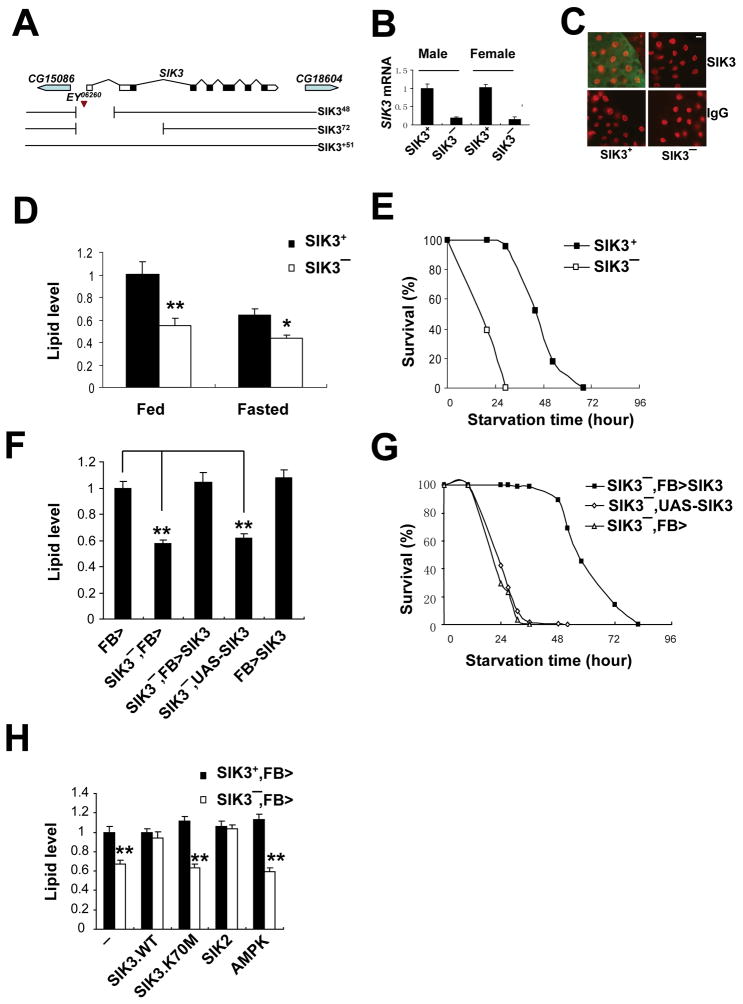
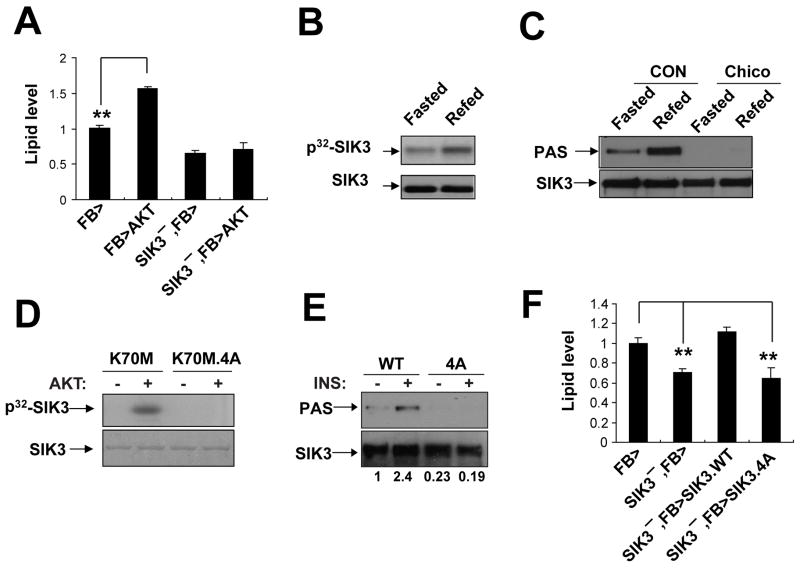
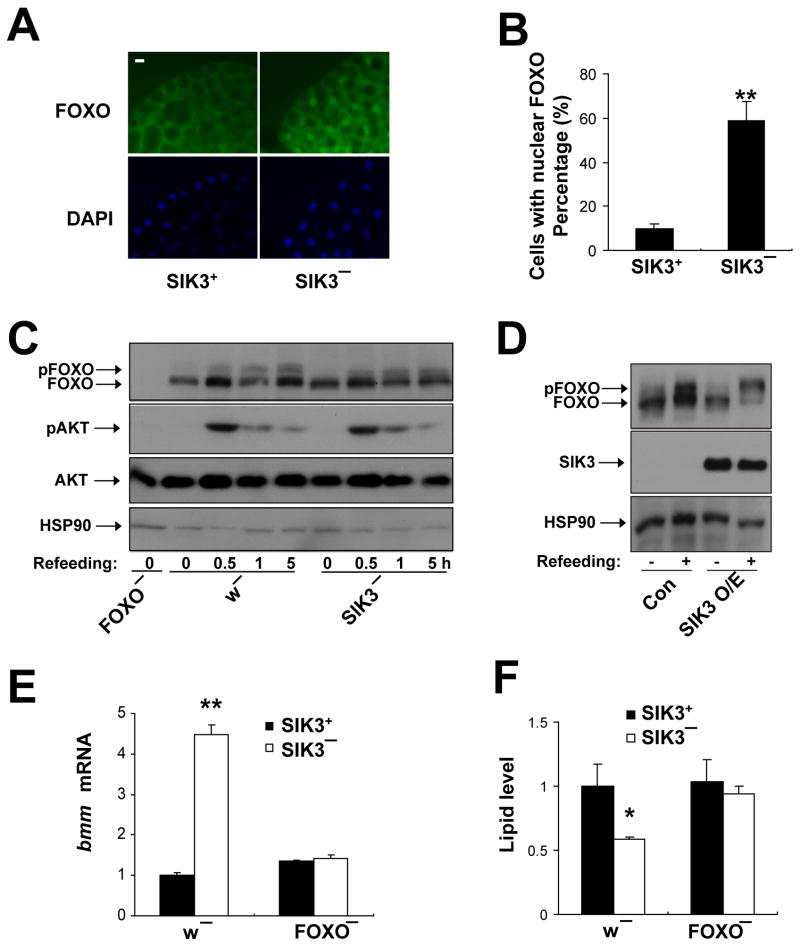
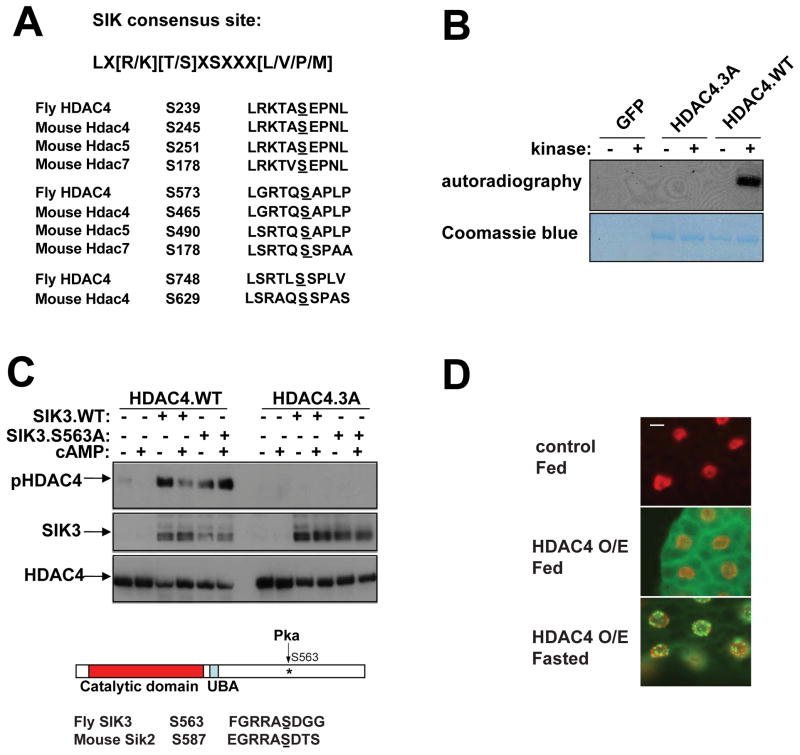
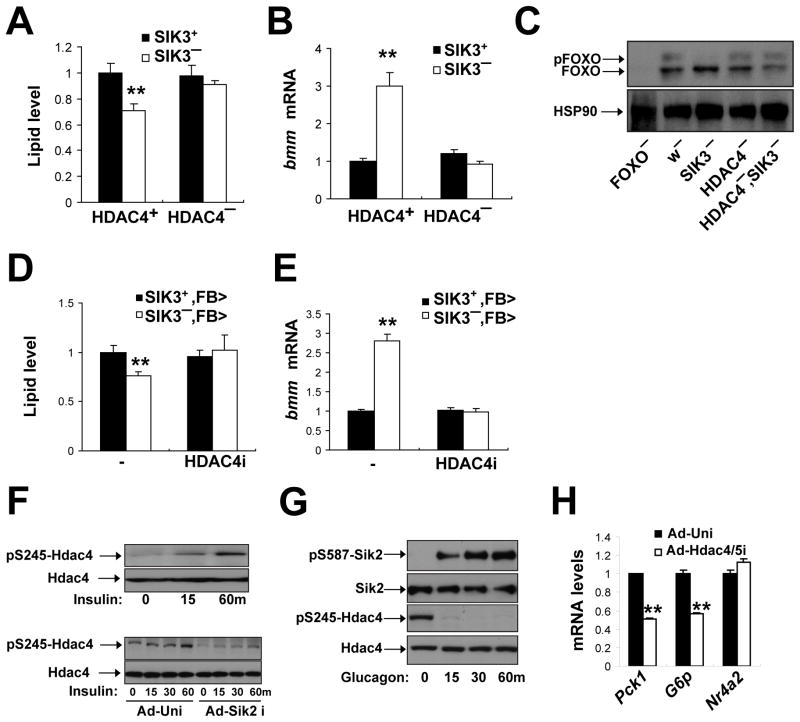
Under fasting conditions, metazoans maintain energy balance by shifting from glucose to fat burning. In the fasted state, SIRT1 promotes catabolic gene expression by deacetylating the forkhead factor FOXO in response to stress and nutrient deprivation. The mechanisms by which hormonal signals regulate FOXO deacetylation remain unclear, however. We identified a hormone-dependent module, consisting of the Ser/Thr kinase SIK3 and the class IIa deacetylase HDAC4, which regulates FOXO activity in Drosophila. During feeding, HDAC4 is phosphorylated and sequestered in the cytoplasm by SIK3, whose activity is upregulated in response to insulin. SIK3 is inactivated during fasting, leading to the dephosphorylation and nuclear translocation of HDAC4 and to FOXO deacetylation. SIK3 mutant flies are starvation sensitive, reflecting FOXO-dependent increases in lipolysis that deplete triglyceride stores; reducing HDAC4 expression restored lipid accumulation. Our results reveal a hormone-regulated pathway that functions in parallel with the nutrient-sensing SIRT1 pathway to maintain energy balance.


Figures

Figure 1
Figure 1. Reduced fat stores in SIK3 mutant flies, also see Figure S1
(A) Diagram of SIK3 (CG15072) genomic locus is depicted. Location of P element EY06260 shown, along with SIK348 and SIK372 deletions generated by imprecise excision. SIK3+51 is a precise excision control line. SIK348 lacks the first (non-coding) exon, resulting in a significant reduction of SIK3 mRNA. The SIK372 deletion extends through the first two exons, removing sequences that encode part of the SIK3 kinase domain, and acts as a null allele. (B) Q-PCR analysis of SIK3 mRNA levels in SIK3+ (SIK3+51) and SIK3 (SIK348) adult male and female flies under feeding conditions. (C) Immunohistochemical analysis of SIK3 expression in fat bodies of WT (yw) and SIK3 (yw;SIK348/Df(2R)P34) L3 larvae. SIK3 protein shown in green, DNA shown in red. Scale bar; 10 μm. (D, E) Relative fasting (24 hours) or ad libitum feeding lipid levels (D) and starvation sensitivities (E) of SIK3+ (SIK3+51) and SIK3 (SIK348) flies. (n=10 per genotype for lipid measurement and n=50 for starvation assays). (F) Effect of fat body (FB) specific expression of SIK3 on lipid levels in SIK3 flies. FB>(FB-GAL4/+), SIK3,FB>(FB-GAL4,SIK348/SIK348), SIK3, FB>SIK3 (FB-GAL4, SIK348/SIK348;UAS-SIK3/+), SIK3,UAS-SIK3(SIK348,UAS-SIK3/+) and FB>SIK3 (FB-GAL4/+; UAS-SIK3/+) flies are shown. (n=16 per genotype). (G) Fat body specific expression of SIK3 rescues starvation sensitivity in SIK3 flies. Shown are survival curves for SIK3, FB>SIK3 (FB-GAL4, SIK348/SIK348;UAS-SIK3/+), SIK3, UAS-SIK3 (SIK348, UAS-SIK3/+) and SIK3, FB> (FB-GAL4, SIK348/SIK348) flies. (n=97-127 per genotype). (H) Lipid levels in SIK3 mutant flies with fat body specific expression of wild-type or catalytically inactive (K70M) SIK3, SIK2, and AMPK. Genotypes are: SIK3, FB> (FB-GAL4, SIK348/SIK348), SIK3+, FB> (FB-GAL4/+), SIK3, FB>SIK3.WT (FB-GAL4, SIK348/SIK348;UAS-SIK3/+), SIK3+, FB>SIK3.WT (FB-GAL4/+;UAS-SIK3/+), SIK3, FB>SIK3.K70M (FB-GAL4, SIK348/SIK348;UAS-SIK3.K70M/+), SIK3+, FB>SIK3.K70M (FB-GAL4/+;UAS-SIK3.K70M/+), SIK3, FB>SIK2 (FB-GAL4, SIK348/SIK348;UAS-SIK2/+), SIK3+, FB>SIK2 (FB-GAL4/+;UAS-SIK2/+), SIK3, FB>AMPK (FB-GAL4, SIK348/SIK348;UAS-AMPKTD/+) and SIK3+, FB>AMPK (FB-GAL4/+;UAS-AMPKTD/+). (n=12 per genotype). Data are averages ± SEM (**, P<0.01; *, P<0.05).
Figure 2
Figure 2. AKT stimulates SIK3 activity during feeding, also see Figure S2
(A) Effect of fat-body specific AKT expression on lipid levels in wild-type and SIK3 flies. Genotypes are: FB> (FB-GAL4/+), FB>AKT (FB-GAL4/UAS-AKT), SIK3, FB> (FB-GAL4,SIK348/SIK348) and SIK3, FB>AKT (FB-GAL4,SIK348/UAS-AKT, SIK348). (n=16 per genotype). (B) SIK3 catalytic activity in 24 hour fasted versus 0.5 hour refed flies, as determined by relative SIK3 autophosphorylation in fat bodies of flies (ppl-GAL4/UAS-SIK3.WT) expressing HA-tagged SIK3. Incorporation of γ32P-labeled ATP by in-vitro kinase assay of anti-HA immunoprecipitates shown. Immunoblot of total SIK3 protein amounts also indicated. (C) Immunoblot showing relative amounts of phosphorylated SIK3 in fat bodies of wild-type and Chico mutant flies. Phospho-SIK3 levels determined using phospho-AKT substrate antibody (PAS). Total SIK3 levels measured with SIK3 antisera on HA-immunoprecipitates prepared from CON (ppl-GAL4,UAS-SIK3/+) and Chico (chico1;ppl-GAL4,UAS-SIK3/+) flies under 24 hour fasted or 0.5 hour refed conditions. (D) In vitro kinase assays showing effect of recombinant AKT on phosphorylation of catalytically inactive (K70M) SIK3. Effect of mutating four putative AKT phosphorylation sites (T281/486A.S293/401A; 4A) in SIK3 on 32P incorporation shown. Total protein amounts for wild-type and 4A mutant SIK3 proteins indicated by Coomassie staining. (E) Immunoblot showing effect of Ala substitutions at putative AKT phosphorylation sites in SIK3 (4A) on SIK3 phosphorylation in Drosophila S2 cells. Immunoblot with PAS antiserum was performed on HA-immunoprecipitates prepared from transfected cells. Exposure to insulin (0.5 hr) indicated. Total amounts of SIK3 shown. Relative amounts of phospho-SIK3, determined by densitometric analysis, indicated below each lane. (F) Lipid levels in SIK3 mutant flies following fat body specific expression of wild-type or AKT phosphorylation-defective (4A) SIK3. Genotypes are: FB>(FB-GAL4/+), SIK3, FB> (FB-GAL4, SIK348/SIK348), SIK3, FB>SIK3.WT (FB-GAL4, SIK348/SIK348;UAS-SIK3/+) and SIK3, FB>SIK3.4A (FB-GAL4, SIK348/SIK348;UAS-SIK3.4A/+). (n=16 per genotype). Data are averages ± SEM (**, P<0.01; *, P<0.05).
Figure 3
Figure 3. SIK3 blocks brummer lipase-dependent lipolysis, see also figure S3
(A) Relative effect of AKH receptor (AKHR) and brummer (bmm) deficiency on lipid levels in wild-type and SIK3 mutant flies. Genotypes are: SIK3+,w (w), SIK3,w (SIK348), SIK3+, AKHR (AKHR1), SIK3, AKHR (AKHR1, SIK348), SIK3+,bmm (bmm1), SIK3,bmm (SIK348;bmm1). (n=16 per genotype). (B) Q-PCR analysis of bmm mRNA amounts in wild-type and SIK3 mutant flies under feeding conditions. Effect of expressing wild-type or kinase-dead (K70M) SIK3 in fat body on bmm mRNA amounts indicated. Genotypes are: SIK3+ (FB-GAL4/+), SIK3: (FB-GAL4, SIK348/SIK348), SIK3+, FB>SIK3.WT (FB-GAL4/+;UAS-SIK3/+), SIK3, FB>SIK3.WT (FB-GAL4,SIK348/SIK348;UAS-SIK3/+), SIK3+, FB>SIK3.K70M (FB-GAL4/+;UAS-SIK3.K70M/+), SIK3, FB>SIK3.K70M (FB-GAL4,SIK348/SIK348;UAS-SIK3.K70M/+) flies. Data are averages ± SEM (**, P<0.01). (C–E) Time course analysis of lipid depletion (C, n=14–20 per genotype), catabolic gene expression (D), and FOXO as well as AKT and SIK3 dephosphorylation (E) during fasting in adult wild-type flies. For panel E, AKT phosphorylated FOXO migrates slower than the unphosphorylated protein (see Figure S4D). Densitometric analysis of phospho-SIK3 amounts from two independent experiments shown. (F) Q-PCR analysis of mRNA amounts for bmm and other fasting-inducible genes (PEPCK, lip3 and 4E-BP) in wild-type (w) and FOXO (FOXO21/FOXO25) mutant flies under fasting (24 hour) or ad libitum feeding conditions.
Figure 4
Figure 4. SIK3 inhibits FOXO activity, also see Figure S4
(A–B) Immunohistochemical analysis and quantification of FOXO localization in SIK3+ (SIK3+51/Df(2R)P34) and SIK3 (SIK348/Df(2R)P34) L3 larvae. Arrows point to nuclear-localized FOXO protein. Scale bar; 10 μm. (B) Percentage of cells with nuclear FOXO staining in (A) shown graphically. At least 400 cells were counted for each genotype. (C,D) Effect of SIK3 depletion (C) or fat body-specific over-expression (D) on FOXO phosphorylation in flies. Genotypes are: w (w), SIK3 (SIK348), FOXO (FOXO21/FOXO25), Con (r4-GAL4,UAS-HAFOXO/+), and SIK3 over-expression (O/E) (r4-GAL4,UAS-HA-FOXO/UAS-SIK3). In panel C, flies were fasted for 24 hours (0) and then refed for 0.5, 1, or 5 hours. In panel D, flies were fasted for 24 hours and refed for 0.5 hours. (E, F) Effect of FOXO gene disruption on brummer mRNA amounts (E) and lipid levels (F) in SIK3 mutant flies. Genotypes are: SIK3+,w (w), SIK3,w (SIK348), SIK3+,FOXO (FOXO21/FOXO25), and SIK3, FOXO (SIK348; FOXO21/FOXO25). (n=24 per genotype). Data are averages ± SEM (**, P<0.01).
Figure 5
Figure 5. SIK3 phosphorylates HDAC4 and promotes its cytoplasmic translocation, also see Figure S5
(A) Alignment of SIK consensus phosphorylation motif with conserved phospho-acceptor sites in HDAC4 and in mammalian class IIa HDACs (Hdac4/5/7). (B) Autoradiogram showing relative phosphorylation of wild-type (HDAC4.WT) and phosphorylation defective (HDAC4.3A) HDAC4 polypeptides by SIK3 in in vitro kinase assays using 32P-labeled ATP. Lower panel shows total protein amounts for HDAC4.WT and HDAC4.3A by Coomassie staining. (C) Immunoblot showing effect of wild-type and PKA phosphorylation defective SIK3 (S563A) on amounts of phospho (Ser239) and total HDAC4 in transfected HepG2 cells. Effect of cAMP agonists (0.5 mM IBMX, 0.5 mM 8-Br-cAMP; 4 hours) on phospho (Ser239) HDAC4 amounts shown. Bottom, diagram of SIK3 showing location of inhibitory PKA phosphorylation site relative to catalytic and ubiquitin binding (UBA) domains indicated. Below, alignment of PKA phosphorylation sites in Drosophila SIK3 and mouse SIK2. (D) Immunohistochemical analysis of FLAG-HDAC4 localization in fed control (r4-GAL4/+), and ad libitum fed or 10 hour fasted HDAC4-over-expressing (r4-GAL4/UAS-HDAC4) L3 larvae. HDAC4 protein shown in green, DNA shown in red. Scale bar; 10 μm.
Figure 6
Figure 6. HDAC4 activates FOXO, also see Figure S6
(A) Immunoblot of FOXO recovered from immunoprecipitates of HDAC4 or control IgG prepared from Drosophila S2 cells. Input amounts of transfected HDAC4 and FOXO shown. (B) Q-PCR analysis of mRNA amounts for fasting inducible genes (PEPCK, bmm, CPTI) in HDAC4 hypomorphic mutant flies (top) or in flies expressing phosphorylation-defective, constitutively active HDAC4.3A in fat-body (bottom). Genotypes are: FB>(FB-GAL4/+) and FB>HDAC4.3A (FB-GAL4/+;UAS-HDAC4.3A/+) for over-expression assays. For HDAC4 hypomorphic mutant flies, genotypes are HDAC4+ (HDAC4KG09091/+) and HDAC4 (HDAC4KG09091/HDAC4e04575). Effects of HDAC4 (top) examined in 24 hour fasted flies. Effects of HDAC4.3A examined under ad libitum feeding conditions. (C) Immunoblot showing time course of FOXO phosphorylation and acetylation during refeeding in wild-type (w), SIK3 mutant (SIK348). Ac-FOXO protein detected using anti ac-FOXO1 (K242/245) antibody after immunoprecipitation with anti- acetyl-lysine antibody. Extract from FOXO mutant (FOXO21/FOXO25) flies (FOXO) included to show specificity of ac-FOXO1 and non-discriminating FOXO antisera. (D) Top: schematic showing domain organization of FOXO, including DNA-binding domain (DBD), nuclear localization sequence (NLS), nuclear export sequence (NES), and trans-activation domain (TA). Middle: alignment of conserved lysine residues in the DBDs of Drosophila FOXO and human FOXO1. Conserved lysine residues that undergo acetylation (Lys 179,182 in Drosophila; Lys 242, 245 in human) shown. Bottom, Immunoblot showing Ac-FOXO, and unphosphorylated (FOXO) or phospho-FOXO (pFOXO) protein amounts in 24 hour fasted or 1 hour refed wild-type (HDAC4+) and HDAC4-mutant (HDAC4) flies. Relative amounts of acetylated FOXO, determined by densitometric analysis, indicated above each lane. Genotypes are: HDAC4+ (HDAC4KG09091/+) and HDAC4 (HDAC4KG09091/HDAC4e04575). (E) In vitro deacetylation assay showing effect of purified HDAC4 on deacetylation of a GST-FOXO (aa.95–195) polypeptide acetylated in vitro with the histone acetyl transferase P300. Immunoblot shows amounts of acetylated FOXO (Ac-FOXO) using anti-acetyl lysine antibody. Input protein amounts for GST-FOXO (aa. 95–195) and HDAC4 proteins determined by Ponceau S staining. (F) Effect of oral supplementation with class I/II HDAC inhibitor trichostatin A (TSA) in the food (10μM) on fat body lipid levels in SIK3 mutant flies. (n=10 per genotype). Genotypes are: w (w) and SIK3 (SIK348). Data are averages ± SEM (**, P<0.01; *, P<0.05).
Figure 7
Figure 7. SIK3 inhibits FOXO activity via an HDAC4-dependent mechanism
(A–C) Effect of HDAC4 gene disruption on lipid levels (A) bmm mRNA amounts (B), and FOXO phosphorylation (C) in SIK3 mutant relative to control flies. Data panels A and B is from ad libitum fed flies. Data in panel C was from 1 hour refed flies. Genotypes are: SIK3+(w), SIK3 (SIK348), SIK3+, HDAC4 (HDAC4KG09091/HDAC4e04575), and SIK3, HDAC4 (HDAC4KG09091/HDAC4e04575; SIK348), FOXO (FOXO21/FOXO25). (n=24 per genotype). (D, E) Effect of fat body-specific depletion of HDAC4 (HDAC4i) on lipid levels (D) and bmm mRNA amounts (E) in SIK3 mutant relative to control flies under feeding conditions. Genotypes are: SIK3+,FB>(FB-GAL4/+), SIK3,FB> (FB-GAL4,SIK348/SIK348), SIK3+,FB>HDAC4i(FB-GAL4/+;UAS-HDAC4 RNAi/+), and SIK3, FB>HDAC4i (FB-GAL4,SIK348/SIK348; UAS-HDAC4 RNAi/+). (n=14–16 per genotype). (F) Immunoblot showing amounts of phosphorylated mouse HDAC4 in extracts from primary hepatocytes following RNAi-mediated depletion of SIK2. Effect of exposure to insulin (100nM) for different times (in minutes) indicated. (G) Immunoblot showing effect of glucagon (100nM) on HDAC4 phosphorylation at Ser245 and on inhibitory phosphorylation of SIK2 at Ser587 in primary mouse hepatocytes. (H) Q-PCR analysis of PEPCK, Glucose 6 phosphatase, and NR4A2 mRNA amounts in primary hepatocytes following exposure to glucagon (100nM) for 1 hour. Effect of adenovirus encoded HDAC4/5 RNAis shown.

Comment in

Similar articles

Cited by

References

    1. Baker KD, Thummel CS. Diabetic larvae and obese flies-emerging studies of metabolism in Drosophila. Cell Metab. 2007;6:257–266. - PMC - PubMed
    1. Barthel A, Schmoll D, Unterman TG. FoxO proteins in insulin action and metabolism. Trends Endocrinol Metab. 2005;16:183–189. - PubMed
    1. Bassel-Duby R, Olson EN. Signaling pathways in skeletal muscle remodeling. Annu Rev Biochem. 2006;75:19–37. - PubMed
    1. Berdeaux R, Goebel N, Banaszynski L, Takemori H, Wandless T, Shelton GD, Montminy M. SIK1 is a class II HDAC kinase that promotes survival of skeletal myocytes. Nat Med. 2007;13:597–603. - PubMed
    1. Bohni R, Riesgo-Escovar J, Oldham S, Brogiolo W, Stocker H, Andruss BF, Beckingham K, Hafen E. Autonomous control of cell and organ size by CHICO, a Drosophila homolog of vertebrate IRS1-4. Cell. 1999;97:865–875. - PubMed

Publication types