Distribution of standing-wave errors in real-ear sound-level measurements
- PMID: 21568416
- PMCID: PMC3108394
- DOI: 10.1121/1.3569726
Distribution of standing-wave errors in real-ear sound-level measurements
Abstract
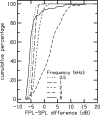
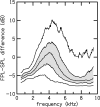
Standing waves can cause measurement errors when sound-pressure level (SPL) measurements are performed in a closed ear canal, e.g., during probe-microphone system calibration for distortion-product otoacoustic emission (DPOAE) testing. Alternative calibration methods, such as forward-pressure level (FPL), minimize the influence of standing waves by calculating the forward-going sound waves separate from the reflections that cause errors. Previous research compared test performance (Burke et al., 2010) and threshold prediction (Rogers et al., 2010) using SPL and multiple FPL calibration conditions, and surprisingly found no significant improvements when using FPL relative to SPL, except at 8 kHz. The present study examined the calibration data collected by Burke et al. and Rogers et al. from 155 human subjects in order to describe the frequency location and magnitude of standing-wave pressure minima to see if these errors might explain trends in test performance. Results indicate that while individual results varied widely, pressure variability was larger around 4 kHz and smaller at 8 kHz, consistent with the dimensions of the adult ear canal. The present data suggest that standing-wave errors are not responsible for the historically poor (8 kHz) or good (4 kHz) performance of DPOAE measures at specific test frequencies.
Figures


Similar articles
-
Effect of calibration method on distortion-product otoacoustic emission measurements at and around 4 kHz.Ear Hear. 2013 Nov-Dec;34(6):779-88. doi: 10.1097/AUD.0b013e3182994f15. Ear Hear. 2013. PMID: 24165303 Free PMC article.
-
Influence of calibration method on distortion-product otoacoustic emission measurements: II. threshold prediction.Ear Hear. 2010 Aug;31(4):546-54. doi: 10.1097/AUD.0b013e3181d86b59. Ear Hear. 2010. PMID: 20458245 Free PMC article.
-
Influence of in situ, sound-level calibration on distortion-product otoacoustic emission variability.J Acoust Soc Am. 2008 Jul;124(1):288-300. doi: 10.1121/1.2931953. J Acoust Soc Am. 2008. PMID: 18646977 Free PMC article.
-
Alternative ear-canal measures related to absorbance.Ear Hear. 2013 Jul;34 Suppl 1(7 0 1):72S-77S. doi: 10.1097/AUD.0b013e31829c7229. Ear Hear. 2013. PMID: 23900185 Free PMC article. Review.
-
Symphonies of Growth: Unveiling the Impact of Sound Waves on Plant Physiology and Productivity.Biology (Basel). 2024 May 7;13(5):326. doi: 10.3390/biology13050326. Biology (Basel). 2024. PMID: 38785808 Free PMC article. Review.
Cited by
-
Supra-threshold auditory brainstem response amplitudes in humans: Test-retest reliability, electrode montage and noise exposure.Hear Res. 2018 Jul;364:38-47. doi: 10.1016/j.heares.2018.04.002. Epub 2018 Apr 6. Hear Res. 2018. PMID: 29685616 Free PMC article.
-
Compensating for ear-canal acoustics when measuring otoacoustic emissions.J Acoust Soc Am. 2017 Jan;141(1):515. doi: 10.1121/1.4973618. J Acoust Soc Am. 2017. PMID: 28147590 Free PMC article.
-
Relation of distortion-product otoacoustic emission input-output functions to loudness.J Acoust Soc Am. 2013 Jul;134(1):369-83. doi: 10.1121/1.4807560. J Acoust Soc Am. 2013. PMID: 23862814 Free PMC article.
-
Effects of Forward- and Emitted-Pressure Calibrations on the Variability of Otoacoustic Emission Measurements Across Repeated Probe Fits.Ear Hear. 2019 Nov/Dec;40(6):1345-1358. doi: 10.1097/AUD.0000000000000714. Ear Hear. 2019. PMID: 30882535 Free PMC article.
-
The relationship and interdependence of auditory thresholds, proposed behavioural measures of hidden hearing loss, and physiological measures of auditory function.Int J Audiol. 2025 Jan;64(1):11-24. doi: 10.1080/14992027.2024.2391986. Epub 2024 Aug 24. Int J Audiol. 2025. PMID: 39180321
References
-
- Gorga, M. P., Neely, S. T., Ohlrich, B., Hoover, B., Redner, J., and Peters, J. (1997). “From laboratory to clinic: A large scale study of distortion product otoacoustic emissions in ears with normal hearing and ears with hearing loss,” Ear Hear. 18(6), 440–455.10.1097/00003446-199712000-00003 - DOI - PubMed
Publication types
MeSH terms
Grants and funding
LinkOut - more resources
Full Text Sources

