

Modulated contact frequencies at gene-rich loci support a statistical helix model for mammalian chromatin organization
- PMID: 21569291
- PMCID: PMC3219965
- DOI: 10.1186/gb-2011-12-5-r42
Modulated contact frequencies at gene-rich loci support a statistical helix model for mammalian chromatin organization
Abstract
Background: Despite its critical role for mammalian gene regulation, the basic structural landscape of chromatin in living cells remains largely unknown within chromosomal territories below the megabase scale.
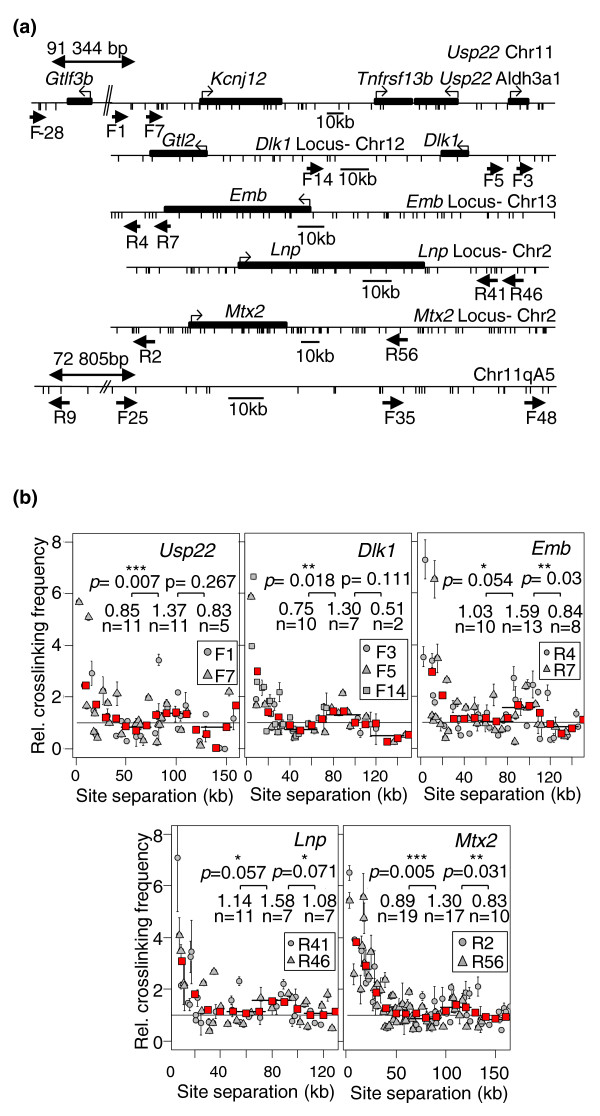
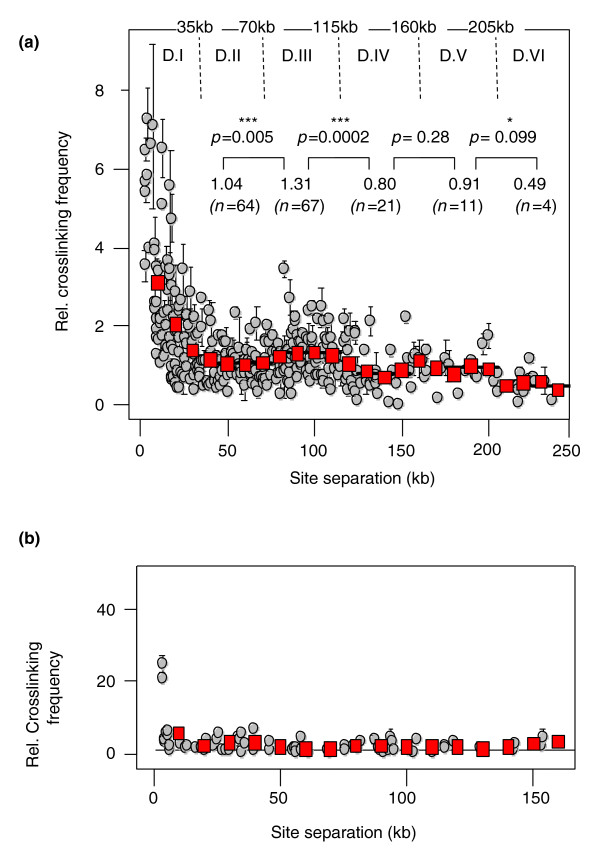
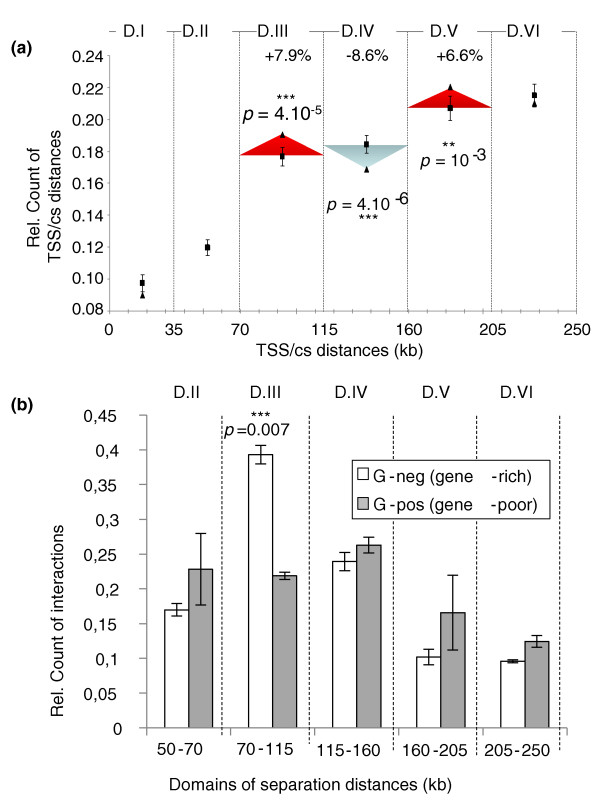
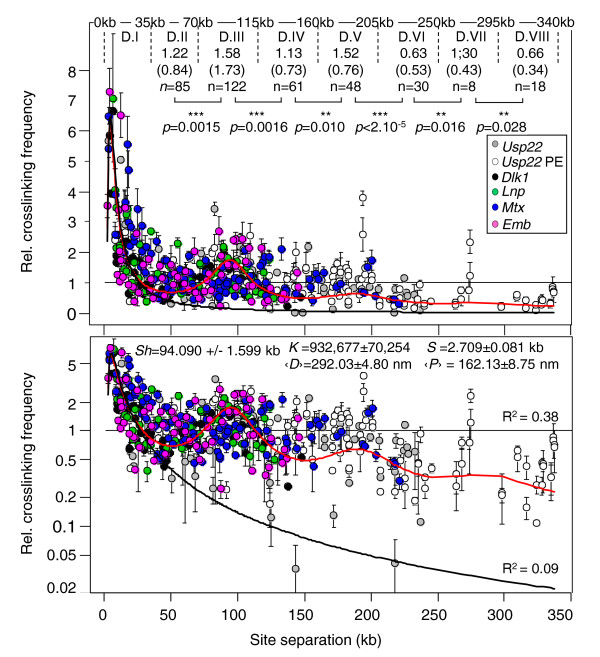
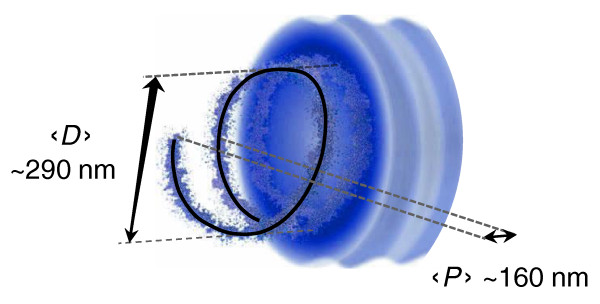
Results: Here, using the 3C-qPCR method, we investigate contact frequencies at high resolution within interphase chromatin at several mouse loci. We find that, at several gene-rich loci, contact frequencies undergo a periodical modulation (every 90 to 100 kb) that affects chromatin dynamics over large genomic distances (a few hundred kilobases). Interestingly, this modulation appears to be conserved in human cells, and bioinformatic analyses of locus-specific, long-range cis-interactions suggest that it may underlie the dynamics of a significant number of gene-rich domains in mammals, thus contributing to genome evolution. Finally, using an original model derived from polymer physics, we show that this modulation can be understood as a fundamental helix shape that chromatin tends to adopt in gene-rich domains when no significant locus-specific interaction takes place.
Conclusions: Altogether, our work unveils a fundamental aspect of chromatin dynamics in mammals and contributes to a better understanding of genome organization within chromosomal territories.
Figures
Comment in
-
Is chromatin helical?Nat Rev Mol Cell Biol. 2011 Nov 30;13(1):6. doi: 10.1038/nrm3247. Nat Rev Mol Cell Biol. 2011. PMID: 22127298 No abstract available.
Similar articles
-
Distinct polymer physics principles govern chromatin dynamics in mouse and Drosophila topological domains.BMC Genomics. 2015 Aug 15;16(1):607. doi: 10.1186/s12864-015-1786-8. BMC Genomics. 2015. PMID: 26271925 Free PMC article.
-
Detecting Spatial Chromatin Organization by Chromosome Conformation Capture II: Genome-Wide Profiling by Hi-C.Methods Mol Biol. 2017;1589:47-74. doi: 10.1007/7651_2015_261. Methods Mol Biol. 2017. PMID: 26900130
-
Simulation of different three-dimensional polymer models of interphase chromosomes compared to experiments-an evaluation and review framework of the 3D genome organization.Semin Cell Dev Biol. 2019 Jun;90:19-42. doi: 10.1016/j.semcdb.2018.07.012. Epub 2018 Aug 24. Semin Cell Dev Biol. 2019. PMID: 30125668 Review.
-
Topological domains in mammalian genomes identified by analysis of chromatin interactions.Nature. 2012 Apr 11;485(7398):376-80. doi: 10.1038/nature11082. Nature. 2012. PMID: 22495300 Free PMC article.
-
Computational approaches for inferring 3D conformations of chromatin from chromosome conformation capture data.Methods. 2020 Oct 1;181-182:24-34. doi: 10.1016/j.ymeth.2019.08.008. Epub 2019 Aug 27. Methods. 2020. PMID: 31470090 Free PMC article. Review.
Cited by
-
Is chromatin helical?Nat Rev Mol Cell Biol. 2011 Nov 30;13(1):6. doi: 10.1038/nrm3247. Nat Rev Mol Cell Biol. 2011. PMID: 22127298 No abstract available.
-
Long non-coding RNA identification over mouse brain development by integrative modeling of chromatin and genomic features.Nucleic Acids Res. 2013 Dec;41(22):10044-61. doi: 10.1093/nar/gkt818. Epub 2013 Sep 13. Nucleic Acids Res. 2013. PMID: 24038472 Free PMC article.
-
Contribution of Topological Domains and Loop Formation to 3D Chromatin Organization.Genes (Basel). 2015 Jul 27;6(3):734-50. doi: 10.3390/genes6030734. Genes (Basel). 2015. PMID: 26226004 Free PMC article. Review.
-
Enhancer-targeted genome editing selectively blocks innate resistance to oncokinase inhibition.Genome Res. 2014 May;24(5):751-60. doi: 10.1101/gr.166231.113. Epub 2014 Jan 17. Genome Res. 2014. PMID: 24443471 Free PMC article.
-
Exploring Mammalian Genome within Phase-Separated Nuclear Bodies: Experimental Methods and Implications for Gene Expression.Genes (Basel). 2019 Dec 17;10(12):1049. doi: 10.3390/genes10121049. Genes (Basel). 2019. PMID: 31861077 Free PMC article. Review.
References
-
- Iborra FJ, Pombo A, Jackson DA, Cook PR. Active RNA polymerases are localized within discrete transcription "factories' in human nuclei. J Cell Sci. 1996;109:1427–1436. - PubMed
-
- Lieberman-Aiden E, van Berkum NL, Williams L, Imakaev M, Ragoczy T, Telling A, Amit I, Lajoie BR, Sabo PJ, Dorschner MO, Sandstrom R, Bernstein B, Bender MA, Groudine M, Gnirke A, Stamatoyannopoulos J, Mirny LA, Lander ES, Dekker J. Comprehensive mapping of long-range interactions reveals folding principles of the human genome. Science. 2009;326:289–293. doi: 10.1126/science.1181369. - DOI - PMC - PubMed
Publication types
MeSH terms
Substances
LinkOut - more resources
Full Text Sources
