

Lipid phosphate phosphatase-3 regulates tumor growth via β-catenin and CYCLIN-D1 signaling
- PMID: 21569306
- PMCID: PMC3112429
- DOI: 10.1186/1476-4598-10-51
Lipid phosphate phosphatase-3 regulates tumor growth via β-catenin and CYCLIN-D1 signaling
Abstract
Background: The acquisition of proliferative and invasive phenotypes is considered a hallmark of neoplastic transformation; however, the underlying mechanisms are less well known. Lipid phosphate phosphatase-3 (LPP3) not only catalyzes the dephosphorylation of the bioactive lipid sphingosine-1-phosphate (S1P) to generate sphingosine but also may regulate embryonic development and angiogenesis via the Wnt pathway. The goal of this study was to determine the role of LPP3 in tumor cells.
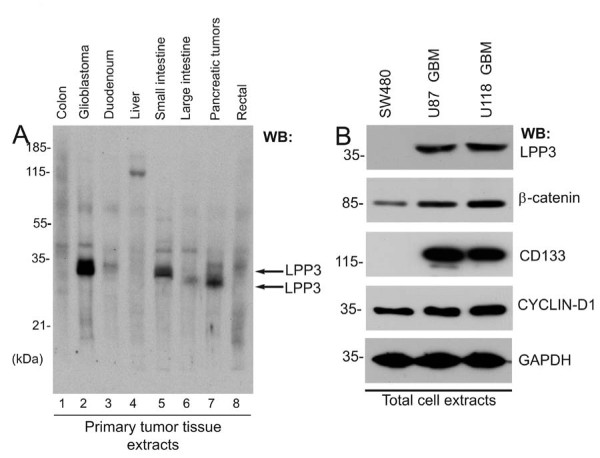
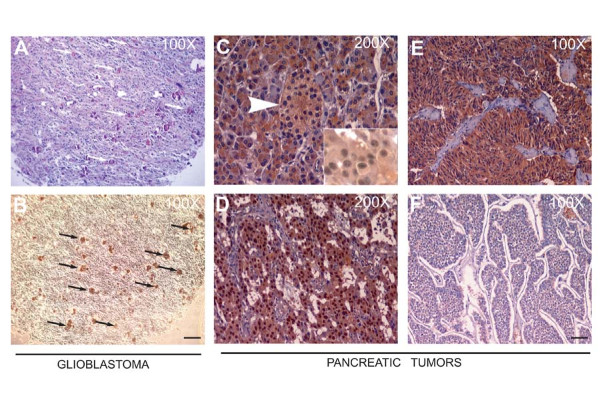
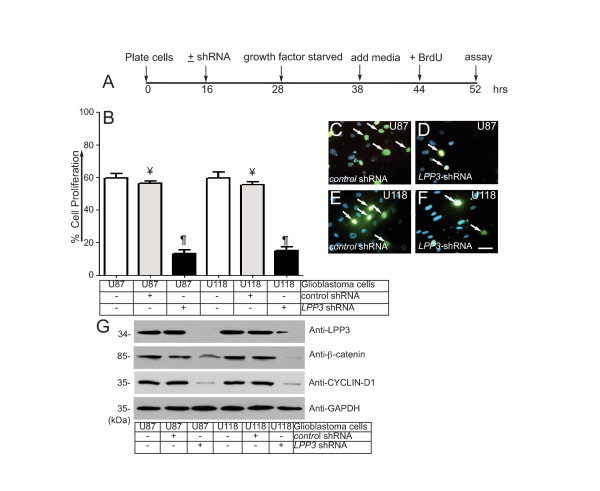
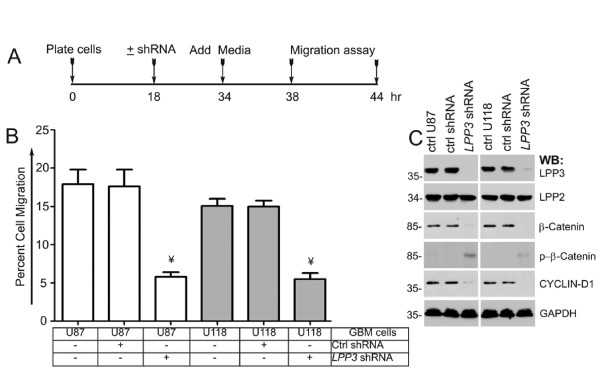
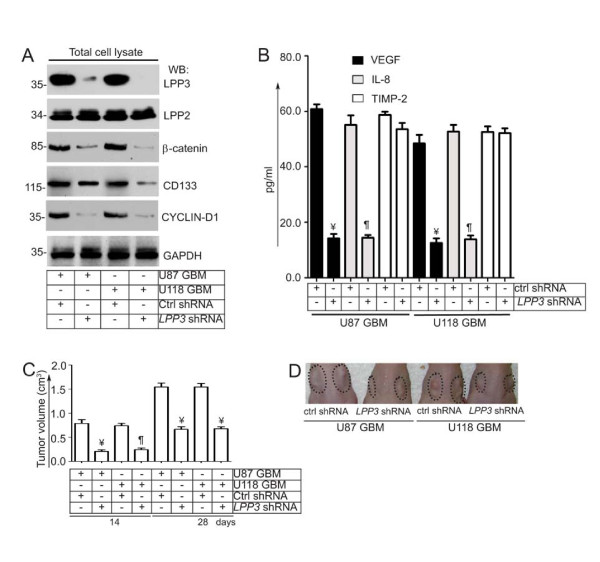
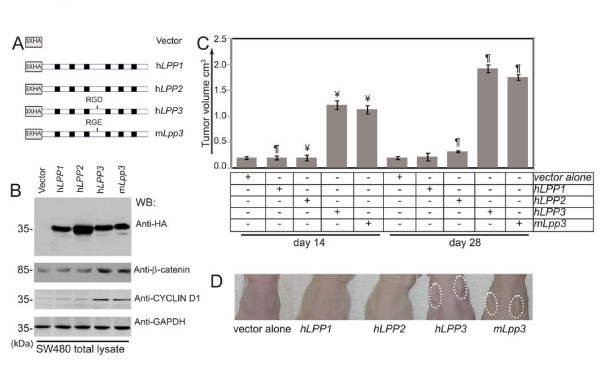
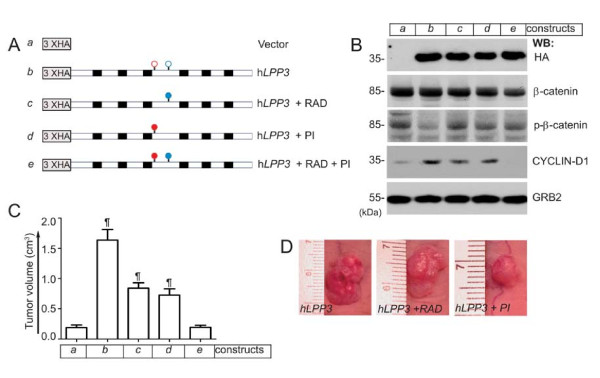
Results: We observed increased expression of LPP3 in glioblastoma primary tumors and in U87 and U118 glioblastoma cell lines. We demonstrate that LPP3-knockdown inhibited both U87 and U118 glioblastoma cell proliferation in culture and tumor growth in xenograft assays. Biochemical experiments provided evidence that LPP3-knockdown reduced β-catenin, CYCLIN-D1, and CD133 expression, with a concomitant increase in phosphorylated β-catenin. In a converse experiment, the forced expression of LPP3 in human colon tumor (SW480) cells potentiated tumor growth via increased β-catenin stability and CYCLIN-D1 synthesis. In contrast, elevated expression of LPP3 had no tumorigenic effects on primary cells.
Conclusions: These results demonstrate for the first time an unexpected role of LPP3 in regulating glioblastoma progression by amplifying β-catenin and CYCLIN-D1 activities.
Figures
Similar articles
-
Lipid phosphate phosphatase 3 stabilization of beta-catenin induces endothelial cell migration and formation of branching point structures.Mol Cell Biol. 2010 Apr;30(7):1593-606. doi: 10.1128/MCB.00038-09. Epub 2010 Feb 1. Mol Cell Biol. 2010. PMID: 20123964 Free PMC article.
-
The lipid phosphatase LPP3 regulates extra-embryonic vasculogenesis and axis patterning.Development. 2003 Oct;130(19):4623-37. doi: 10.1242/dev.00635. Development. 2003. PMID: 12925589
-
Endothelial lipid phosphate phosphatase-3 deficiency that disrupts the endothelial barrier function is a modifier of cardiovascular development.Cardiovasc Res. 2016 Jul 1;111(1):105-18. doi: 10.1093/cvr/cvw090. Epub 2016 Apr 28. Cardiovasc Res. 2016. PMID: 27125875 Free PMC article.
-
Lipid phosphate phosphatase 3 in vascular pathophysiology.Atherosclerosis. 2018 Apr;271:156-165. doi: 10.1016/j.atherosclerosis.2018.02.025. Epub 2018 Mar 2. Atherosclerosis. 2018. PMID: 29518748 Review.
-
Lipid phosphate phosphatase (LPP3) and vascular development.Biochim Biophys Acta. 2013 Jan;1831(1):126-32. doi: 10.1016/j.bbalip.2012.07.012. Epub 2012 Jul 24. Biochim Biophys Acta. 2013. PMID: 22835522 Free PMC article. Review.
Cited by
-
Emerging role of sphingosine-1-phosphate signaling in head and neck squamous cell carcinoma.Onco Targets Ther. 2016 May 31;9:3269-80. doi: 10.2147/OTT.S99989. eCollection 2016. Onco Targets Ther. 2016. PMID: 27330306 Free PMC article. Review.
-
Arguing the case for the autotaxin-lysophosphatidic acid-lipid phosphate phosphatase 3-signaling nexus in the development and complications of atherosclerosis.Arterioscler Thromb Vasc Biol. 2014 Mar;34(3):479-86. doi: 10.1161/ATVBAHA.113.302737. Epub 2014 Jan 30. Arterioscler Thromb Vasc Biol. 2014. PMID: 24482375 Free PMC article. Review.
-
Mice with targeted inactivation of ppap2b in endothelial and hematopoietic cells display enhanced vascular inflammation and permeability.Arterioscler Thromb Vasc Biol. 2014 Apr;34(4):837-45. doi: 10.1161/ATVBAHA.113.302335. Epub 2014 Feb 6. Arterioscler Thromb Vasc Biol. 2014. PMID: 24504738 Free PMC article.
-
Downregulation of Lipid Phosphate Phosphatase 3 Correlates With Tumor-Infiltrating Immune Cells in Oral Cancer.Cureus. 2022 Mar 27;14(3):e23553. doi: 10.7759/cureus.23553. eCollection 2022 Mar. Cureus. 2022. PMID: 35494957 Free PMC article.
-
Targeting sphingosine-1-phosphate signaling in lung diseases.Pharmacol Ther. 2016 Dec;168:143-157. doi: 10.1016/j.pharmthera.2016.09.008. Epub 2016 Sep 13. Pharmacol Ther. 2016. PMID: 27621206 Free PMC article. Review.
References
-
- Alderton F, Darroch P, Sambi B, McKie A, Ahmed IS, Pyne N, Pyne S. G-protein-coupled receptor stimulation of the p42/p44 mitogen-activated protein kinase pathway is attenuated by lipid phosphate phosphatases 1, 1a and 2 in human embryonic kidney 293 cells. J Biol Chem. 2001;276:13452–13460. doi: 10.1074/jbc.M006582200. - DOI - PubMed
Publication types
MeSH terms
Substances
Grants and funding
LinkOut - more resources
Full Text Sources
Molecular Biology Databases
Research Materials
