. 2011 May 12:12:232.
doi: 10.1186/1471-2164-12-232.

The effect of measurement error of phenotypes on genome wide association studies

Affiliations

The effect of measurement error of phenotypes on genome wide association studies

William Barendse. BMC Genomics. .

Abstract

Background: There is an unspoken assumption that imprecision of measurement of phenotypes will not have large systematic effects on the location of significant associations in a genome wide association study (GWAS). In this report, the effects of two independent measurements of the same trait, subcutaneous fat thickness, were examined in GWAS of 940 individuals.

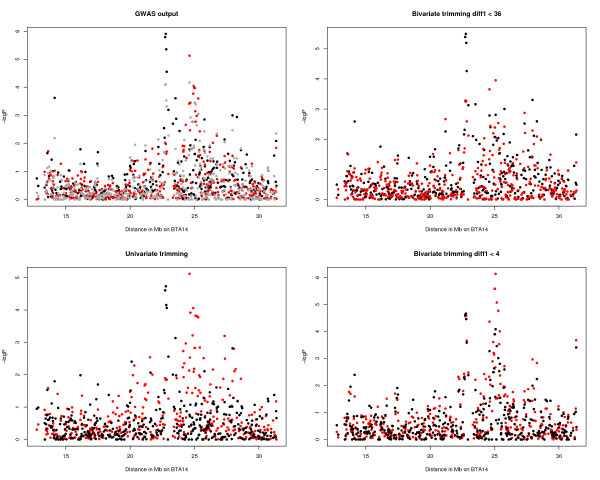
Results: The trait values obtained by two independent groups working to the same trait definition were correlated with r = 0.72. The allele effects obtained from the two analyses were only moderately correlated, with r = 0.53, and there was one significant (P < 0.0001) association in common to the two measurements. The correlation between allele effects was approximately equal to the square of the correlation between the trait measurements. An important quantitative trait locus (QTL) on BTA14 appeared to be shifted distally by 1 Mb along the chromosome. The divergence in GWAS was stronger with data coded into two discrete classes. Univariate trimming of the top and bottom 5% of data, a method used to control for erroneous trait values, decreased the similarity between the GWAS and increased the apparent shift of the QTL on BTA14. Stringent bivariate trimming of data, using only trait values that were similar to each other in the two data sets, substantially improved the correlation of trait values and allele effects in the GWAS, and showed evidence for two QTL on BTA14 separated by 1 Mb. Despite the reduction in sample size due to trimming, more SNP were significant. Using the mean of the two measurements of the trait was not as efficient as bivariate trimming.

Conclusions: It is recommended that trait values in GWAS experiments be examined for repeatability before the experiment is performed. For traits that do not have high repeatability (r < 0.95), two or more independent measurements of the same trait should be obtained for all samples, and individuals genotyped that have highly correlated trait measurements.


Figures

Figure 1
Figure 1
Distribution of trait measurements in the sample. A. Histogram of CHILLP8 fat thickness for animals in the GWAS sample. Note the excess frequency at 10 mm, B. Histogram of P8FAT thickness for animals in the GWAS sample, note the excess frequency at 10 mm and that the distribution appears less smooth than the CHILLP8 distribution.
Figure 2
Figure 2
Deviation between the two measurements of the trait. A. Bivariate plot of CHILLP8 and P8FAT for animals in this study, this plot does not show the bivariate density of the two measurements because all the measurements are integers so they stack one on top of the other. B. Histogram of squared differences between CHILLP8 and P8FAT measurements for the GWAS sample, note that the difference between the vast majority of measurements is < 5 mm.
Figure 3
Figure 3
The Q-Q plot of t-values in the CHILLP8 GWAS. The quantile-quantile plot of the observed distribution of the t-values for the GWAS of CHILLP8 compared to the theoretical distribution. The plot represents at least 50 thousand data points. Points at the extreme of the observed distribution show values that were larger than expected.
Figure 4
Figure 4
Evidence for QTLs on BTA14 under different kinds and amounts of data trimming. Manhattan plots of SNP associations to CHILLP8 (black) and P8FAT (red) plotted against distance along part of chromosome BTA14 in Mb. The four panels show the original GWAS data, which also includes P8MEAN (dark grey), the univariate trimmed data excluding the top and bottom 5% of values, the bivariate trimmed data with the threshold set at diff1 < 36, and the bivariate trimmed data with the threshold set at diff1 < 4.
Figure 5
Figure 5
The divergence between allele effects and their significance in the GWAS of the two trait measurements. A. Bivariate plot of allele effects of CHILLP8 (x-axis) and P8FAT (y-axis), the relationship has a correlation of r = 0.53, B. Bivariate plot of -logP values of CHILLP8 (x-axis) and P8FAT (y-axis), the relationship has a correlation of r = 0.36.

References

    1. Ozaki K, Ohnishi Y, Iida A, Sekine A, Yamada R, Tsunoda T, Sato H, Sato H, Hori M, Nakamura Y. et al.Functional SNPs in the lymphotoxin-α gene that are associated with susceptibility to myocardial infarction. Nat Genet. 2002;32(4):650–654. doi: 10.1038/ng1047. - DOI - PubMed
    1. Chanock SJ, Manolio T, Boehnke M, Boerwinkle E, Hunter DJ, Thomas G, Hirschhorn JN, Abecasis G, Altshuler D, Bailey-Wilson JE. et al.Replicating genotype-phenotype associations. Nature. 2007;447(7145):655–660. doi: 10.1038/447655a. - DOI - PubMed
    1. Weedon MN, Lango H, Lindgren CM, Wallace C, Evans DM, Mangino M, Freathy RM, Perry JRB, Stevens S, Hall AS. et al.Genome-wide association analysis identifies 20 loci that influence adult height. Nat Genet. 2008;40(5):575–583. doi: 10.1038/ng.121. - DOI - PMC - PubMed
    1. Lohmueller KE, Pearce CL, Pike M, Lander ES, Hirschhorn JN. Meta-analysis of genetic association studies supports a contribution of common variants to susceptibility to common disease. Nat Genet. 2003;33(2):177–182. doi: 10.1038/ng1071. - DOI - PubMed
    1. Burton PR, Clayton DG, Cardon LR, Craddock N, Deloukas P, Duncanson A, Kwiatkowski DP, McCarthy MI, Ouwehand WH, Samani NJ. et al.Genome-wide association study of 14,000 cases of seven common diseases and 3,000 shared controls. Nature. 2007;447(7145):661–678. doi: 10.1038/nature05911. - DOI - PMC - PubMed

LinkOut - more resources