. 2011 Sep;49(3):395-403.
doi: 10.1016/j.bone.2011.04.018. Epub 2011 May 1.

Absence of the lysophosphatidic acid receptor LPA1 results in abnormal bone development and decreased bone mass

Affiliations

Absence of the lysophosphatidic acid receptor LPA1 results in abnormal bone development and decreased bone mass

Isabelle Gennero et al. Bone. 2011 Sep.

Abstract

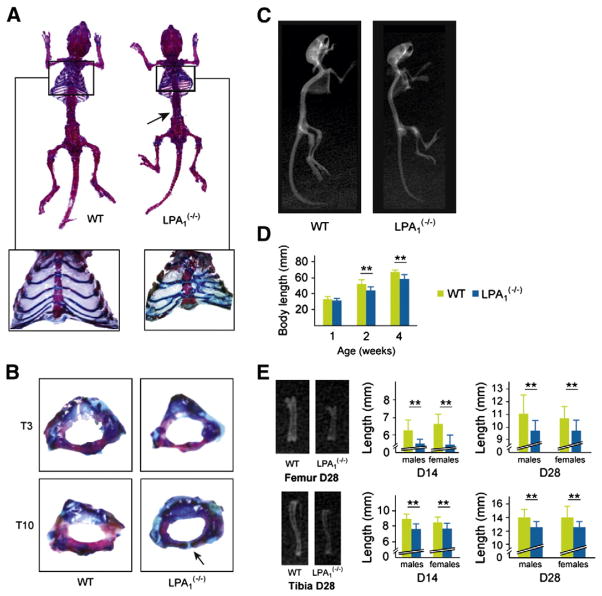
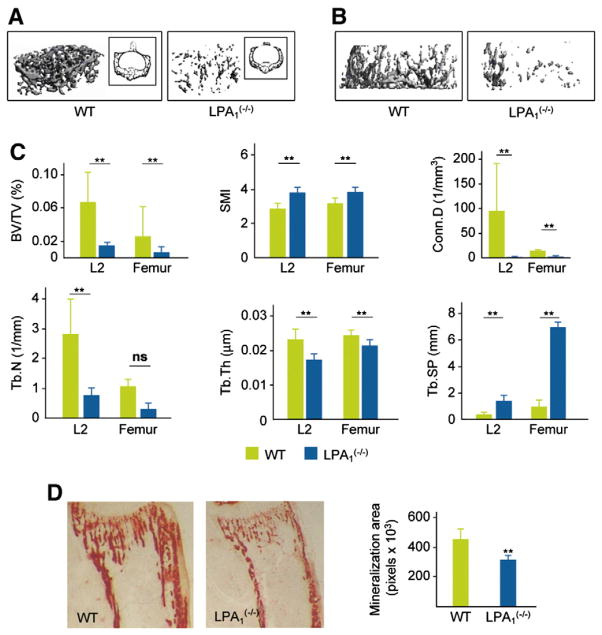
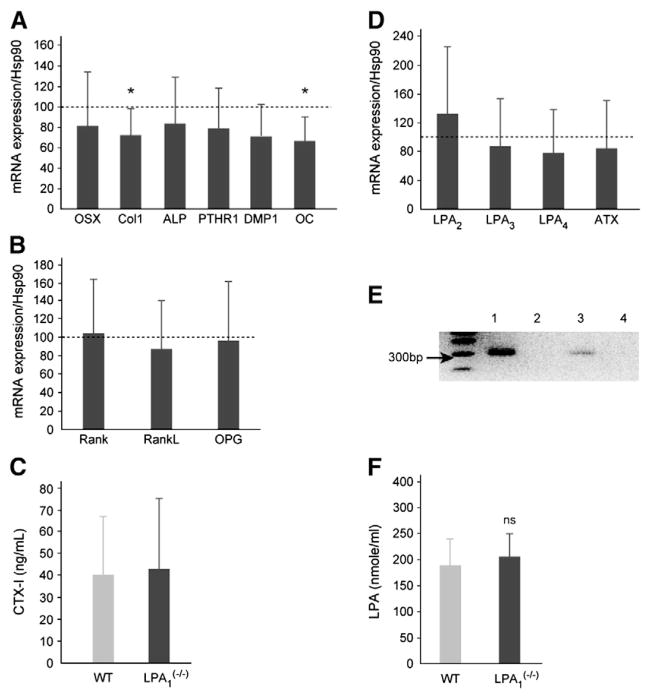
Lysophosphatidic acid (LPA) is a lipid mediator that acts in paracrine systems via interaction with a subset of G protein-coupled receptors (GPCRs). LPA promotes cell growth and differentiation, and has been shown to be implicated in a variety of developmental and pathophysiological processes. At least 6 LPA GPCRs have been identified to date: LPA1-LPA6. Several studies have suggested that local production of LPA by tissues and cells contributes to paracrine regulation, and a complex interplay between LPA and its receptors, LPA1 and LPA4, is believed to be involved in the regulation of bone cell activity. In particular, LPA1 may activate both osteoblasts and osteoclasts. However, its role has not as yet been examined with regard to the overall status of bone in vivo. We attempted to clarify this role by defining the bone phenotype of LPA1((-/-)) mice. These mice demonstrated significant bone defects and low bone mass, indicating that LPA1 plays an important role in osteogenesis. The LPA1((-/-)) mice also presented growth and sternal and costal abnormalities, which highlights the specific roles of LPA1 during bone development. Microcomputed tomography and histological analysis demonstrated osteoporosis in the trabecular and cortical bone of LPA1((-/-)) mice. Finally, bone marrow mesenchymal progenitors from these mice displayed decreased osteoblastic differentiation. These results suggest that LPA1 strongly influences bone development both qualitatively and quantitatively and that, in vivo, its absence results in decreased osteogenesis with no clear modification of osteoclasis. They open perspectives for a better understanding of the role of the LPA/LPA1 paracrine pathway in bone pathophysiology.


Conflict of interest statement

Conflict of interest. All authors have no conflict of interest.

Figures

Fig. 1
Fig. 1
Gross phenotype of LPA1(−/−) mice. Alizarin red S (AR) and alcian blue (AB) staining and X-ray analysis of LPA1(−/−) and WT littermates. (A) Skeletal staining of 4-week-old LPA1(−/−) and WT mice showing homogeneous dwarfism in LPA1(−/−) mice (n=10). These mice also show increased AB staining suggesting an alteration in the bone mineralization process. Close-up AR/AB staining of LPA1(−/−) and WT mice rib cages demonstrates multiple sterno-distal rib fusions and sternebrae abnormalities. Arrow: AB staining of intervertebral discs and vertebral extremities. (B) At D14, LPA1(−/−) thoracic vertebrae are smaller and not fully mineralized (arrow) when compared with WT littermates. (C) Profile whole-body X-ray analysis of the skeleton of 4-week-old LPA1(−/−) and WT mice showing homogeneous dwarfism and less mineralization in LPA1(−/−) vertebrae and long bones. (D) Growth curves of 1-, 2-, and 4-week-old LPA1(−/−) mice (black columns) and WT mice (white columns) (n=10, 15 and 10, respectively). (E) Representative X-ray analysis of 4-week-old LPA1(−/−) and WT mice femurs (upper left) and tibias (lower left) showing size and mineralization differences. Femur lengths of 2- and 4-week-old male and female LPA1(−/−) mice (blue columns) and WT mice (green columns) (n=6) (upper middle and right). Tibia lengths of 2- and 4-week-old male and female LPA1(−/−) mice (black columns) and WT mice (white columns) (n=6) (lower middle and right). LPA1(−/−) femurs and tibias are smaller and less mineralized in the cortical and trabecular areas of the bone than WT littermates. Values are means (SD). Significant statistical differences between groups: **p<0.01, LPA1(−/−) vs. WT by the Mann–Whitney test.
Fig. 2
Fig. 2
Altered vertebral and femoral trabecular bone of LPA1(−/−) mice. (A) μCT visualization of L2 vertebra in 4-week-old LPA1(−/−) mice and WT littermates (n=6). (B) μCT visualization of trabecular area of the femur in 4-week-old LPA1(−/−) mice and WT littermates (n=6). (C)High resolution μCT parameters were measured in LPA1−/− and WT mice (n=6). Values analyzed in L2 vertebrae and the trabecular area of the femur were BV/TV, bone volume/total volume; Tb.Th, trabecular thickness; Tb.N, trabecular number; Tb.Sp, trabecular spacing; Conn.D, connectivity density; SMI, structure model index. (D) Alizarin red (AR) staining of the proximal extremity of the tibia in 2-week-old LPA1(−/−) mice and WT littermates. Mineralization area was quantified in pixels, LPA1(−/−) (blue columns) and WT (green columns) (n=4). Values are means (SD). Significant statistical differences between groups: *p<0.05, **p<0.01 for LPA1(−/−) vs. WT by the Mann–Whitney test.
Fig. 3
Fig. 3
Altered femoral cortical bone of LPA1(−/−) mice. (A) μCT visualization of the cortical region of the femur in 4-week-old LPA1(−/−) mice and WT littermates (n=6). (B) High resolution μCT parameters were measured in femurs of six 4-week-old LPA1 −/− and WT mice as described in Materials and methods. Values analyzed were Ct.Th, cortical thickness; Ct.Ar, cortical area; Ma.Ar, marrow area; T.Ar, cross-sectional total area. Values are means (SD). Significant statistical differences between groups: *p<0.05, **p<0.001 for LPA1(−/−) vs. WT by the Mann–Whitney test.
Fig. 4
Fig. 4
Bone mineral density and mineral and nutritional status in LPA1(−/−) mice. (A) μCT mineral density is conserved in LPA1(−/−) mice. High resolution μCT parameters were measured in LPA1 −/− and WT mice (n=6). Vertebral and femoral trabecular bone mineral density, BMDtrab, and femoral cortical bone mineral density, BMDcort, were analyzed. (B) Nutritional and mineral status of LPA1(−/−) mice. Values of serum glucose (mmol/l), albumin and total proteins (g/l), 25 OH vitamin D (ng/ml), iron (mg/l). These values were similar in the LPA1(−/−) mice and WT littermates (n=10). Values of total calcium, phosphate, and magnesium (mmol/l). Values were similar in the LPA1(−/−) mice and WT littermates (n=10). (C) Infrared spectra of the cortical area of femurs and tibiae did not show any clear difference between 4-week-old LPA1(−/−) (dotted line) and WT mice (black line) (n=8). (D) Ratio of the absorbance at 1034 and 1660 cm−1, which reflects mineralization status (ratio of the mineral to organic phases) showed no differences between LPA1(−/−) and WT mice (n=8). Values are means (SD). Significant statistical differences between groups: *p<0.05, **p<0.001 of LPA1(−/−) vs. WT mice by the Mann–Whitney test.
Fig. 5
Fig. 5
Expression of bone markers and LPA receptors in LPA1(−/−) mice. (A) Real time RT-PCR of bone markers in long bones of LPA1(−/−) mice: RNAs were extracted from the humerus and radius of 4-week-old LPA1(−/−) mice and WT littermates (n=9). Expression of collagen 1a (Col 1), alkaline phosphatase (ALP), osterix (OST), osteocalcin (OC), PTH receptor 1 (PTHR1) and dentin matrix protein 1 (DMP1) was tested. Dashed line represents the level normalized to 100% of values observed in WT mice. Columns represent the level of gene expression in LPA1(−/−) mice. (B) Expression of receptor activator of nuclear factor κB (RANK), receptor activator of nuclear factor κB-ligand (RANKL) and osteoprotegerin (OPG) was tested. Dashed line represents the level normalized to 100% of values observed in WT mice. Columns represent the level of gene expression in LPA1(−/−) mice. (C) Values of serum CTX-I (ng/mL), reflecting collagen I degradation, were similar in LPA1(−/−) mice and WT littermates (n=7). (D) Expression of LPA2, LPA3, LPA4 and autotaxin (ATX) was assessed by real time RT-PCR. Dashed line represents the level normalized to 100% of values observed in the WT. Columns represent the level of gene expression in LPA1(−/−) mice. (E) PCR detection of LPA1 receptor in WT and LPA1(−/−) mice. Lanes 1 and 2 represent the genomic detection by PCR of LPA1 receptor in DNA of WT and LPA1(−/−) mice, respectively. Lanes 3 and 4 represent the detection by RT-PCR of LPA1 receptor in bones of WT mice of LPA1(−/−) mice respectively.(F) LPA concentration in plasma from LPA1(−/−) and WT mice. LPA concentration was evaluated in fasting mice as described in Materials and methods. Values are not significantly different between LPA1(−/−) and WT mice. Values are means (SD). Significant statistical differences between groups: *p<0.05 of LPA1(−/−) vs. WT by the Mann–Whitney test.
Fig. 6
Fig. 6
LPA1(−/−) mBMSC display decreased proliferation and mineralization. (A) WT and LPA1(−/−) mBMSC were seeded and cultured for 2 days (D0) in medium with 10% FCS (see Materials and methods) and tested at D0, D3, D7 and D10, and DNA content was measured using the Picogreen® assay. (B) mBMSC were cultured in osteogenic medium for 7, 10, or 14 days and stained with alizarin red S solution to evaluate mineralization. Lower mineralization at D7 and D10 was observed in LPA1(−/−) mBMSC cultures. Values are means (SD). Significant statistical differences between groups: ##p<0.001 ofWTD0 vs. D7 or D10; *p<0.05, **p<0.001 of LPA1(−/−) vs. WT by the Mann–Whitney test.

References

    1. Ralston SH, Uitterlinden AG. Genetics of osteoporosis. Endocr Rev. 2010;31:629–62. - PubMed
    1. Chun J, Hla T, Lynch KR, Spiegel S, Moolenaar WH International Union of Basic and Clinical Pharmacology. LXXVIII. Lysophospholipid receptor nomenclature. Pharmacol Rev. 2010;62:579–87. - PMC - PubMed
    1. Fourcade O, Simon MF, Viode C, Rugani N, Leballe F, Ragab A, et al. Secretory phospholipase A2 generates the novel lipid mediator lysophosphatidic acid in membrane microvesicles shed from activated cells. Cell. 1995;80:919–27. - PubMed
    1. Gaits F, Fourcade O, Le Balle F, Gueguen G, Gaige B, Gassama-Diagne A, et al. Lysophosphatidic acid as a phospholipid mediator: pathways of synthesis. FEBS Lett. 1997;410:54–8. - PubMed
    1. Ferry G, Tellier E, Try A, Gres S, Naime I, Simon MF, et al. Autotaxin is released from adipocytes, catalyzes lysophosphatidic acid synthesis, and activates preadipocyte proliferation. Up-regulated expression with adipocyte differentiation and obesity. J Biol Chem. 2003;278:18162–9. - PMC - PubMed

Publication types

MeSH terms