. 2011 Jul 15;355(2):250-62.
doi: 10.1016/j.ydbio.2011.04.022. Epub 2011 Apr 23.

Reversible response of protein localization and microtubule organization to nutrient stress during Drosophila early oogenesis

Affiliations

Reversible response of protein localization and microtubule organization to nutrient stress during Drosophila early oogenesis

Yuko Shimada et al. Dev Biol. .

Abstract

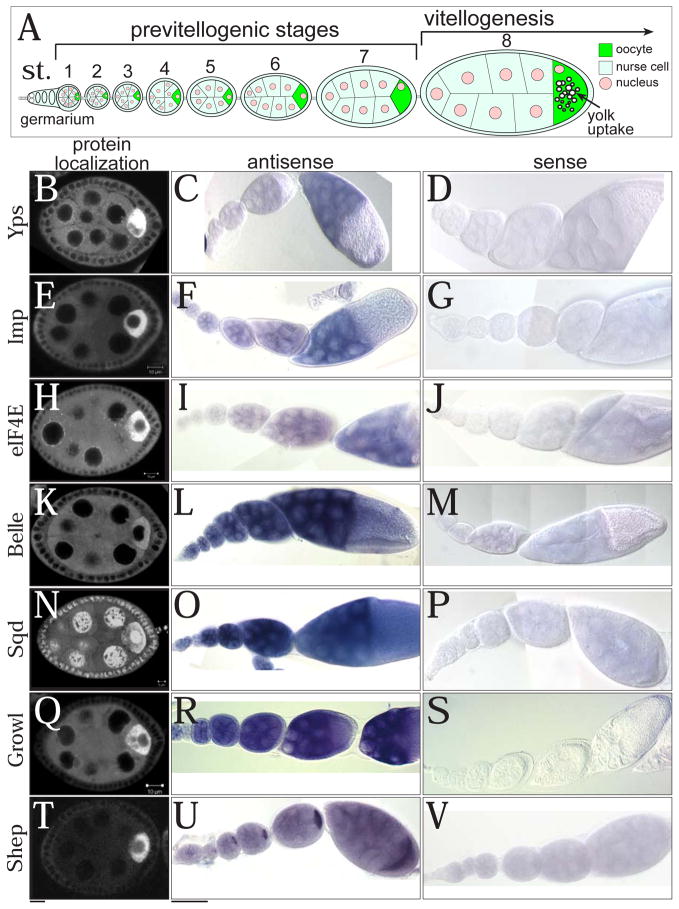
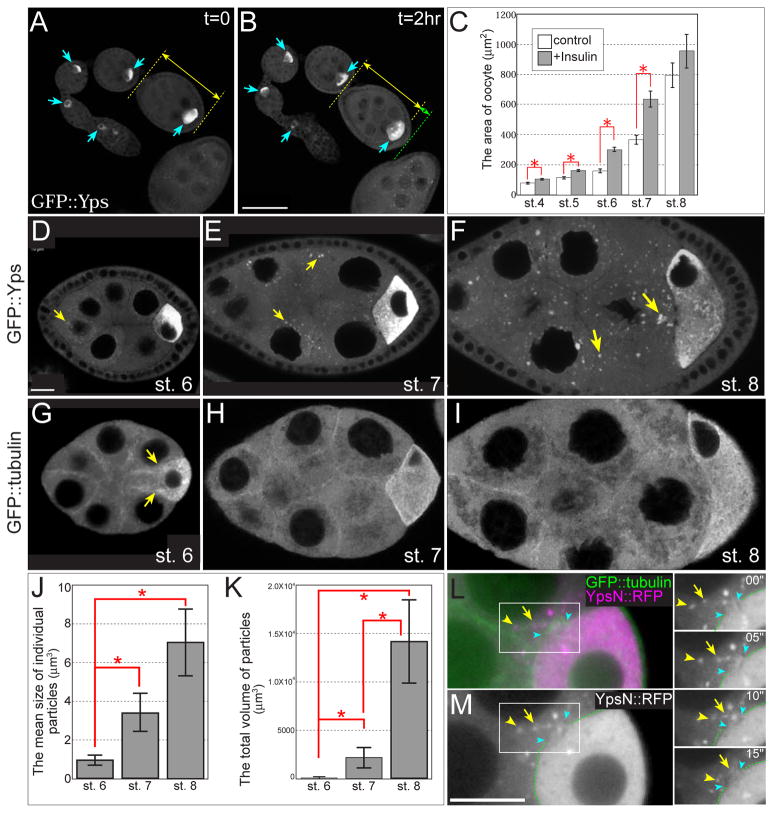
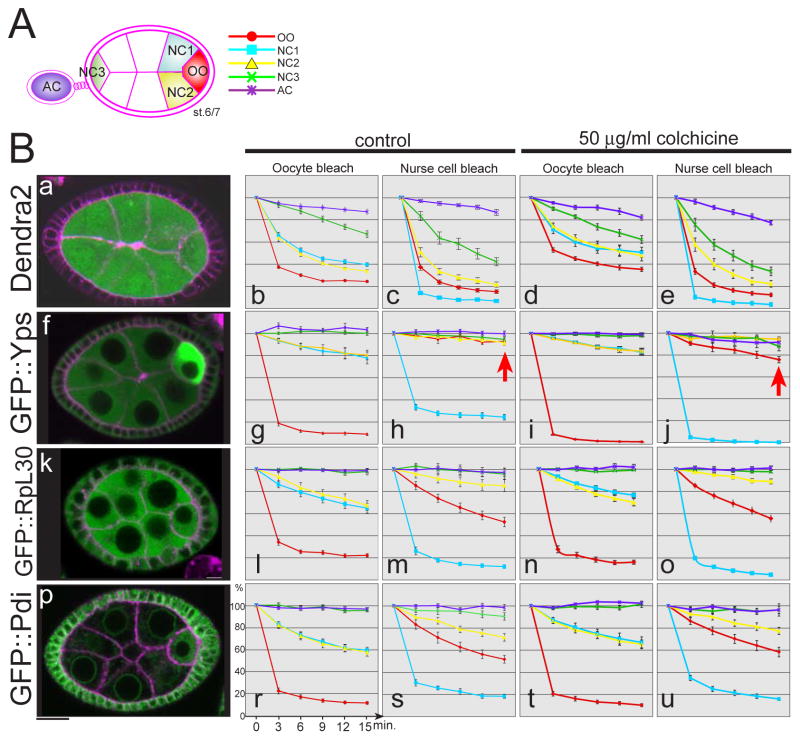
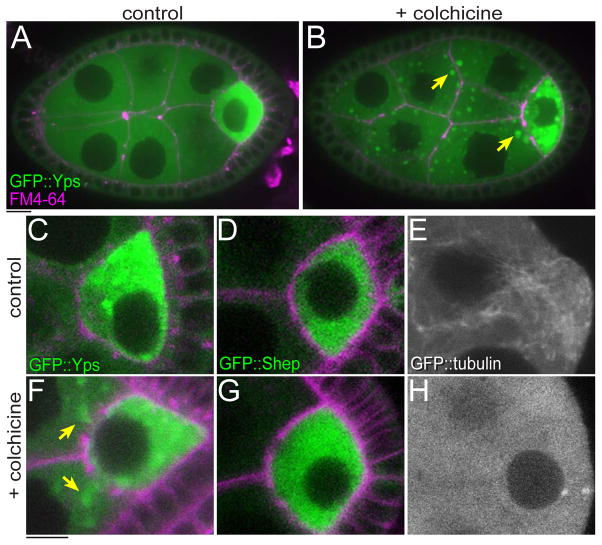
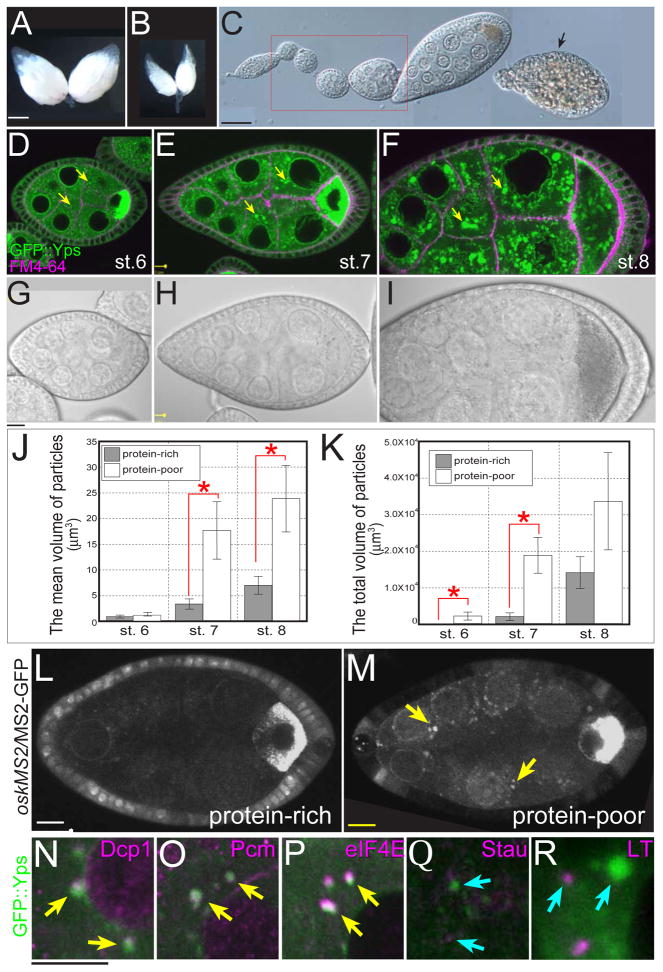
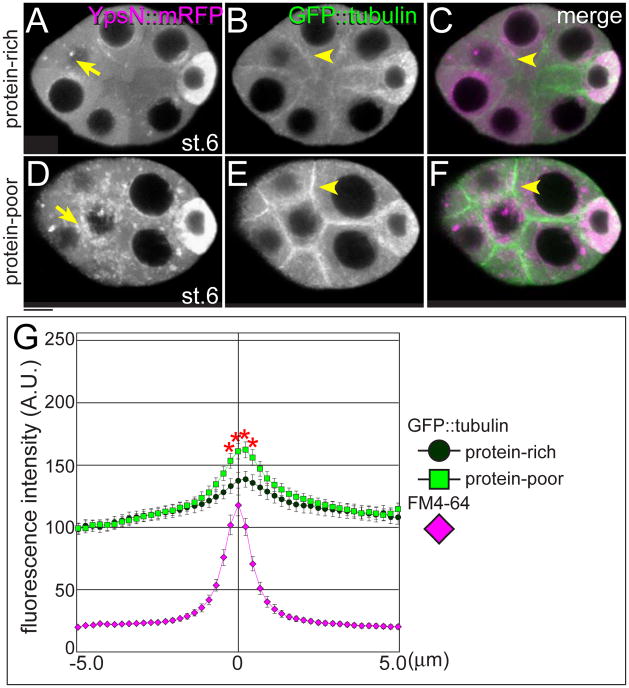
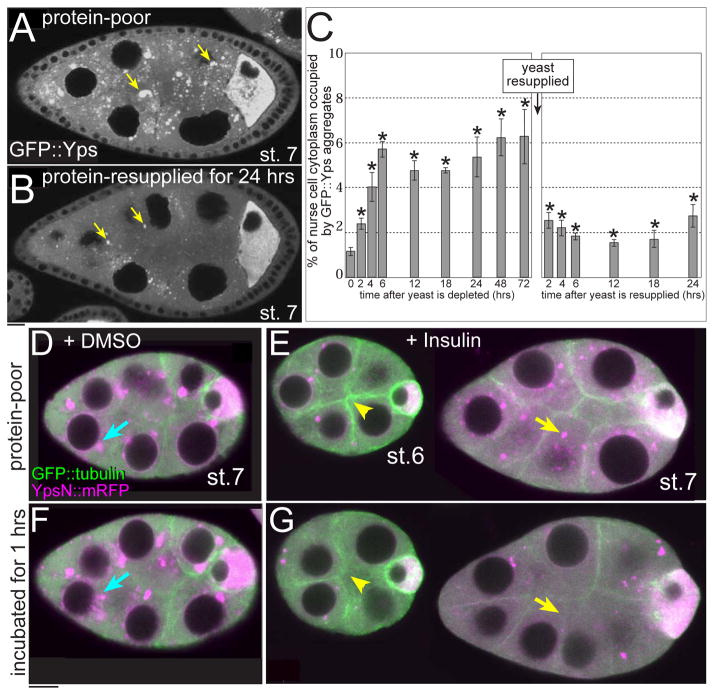
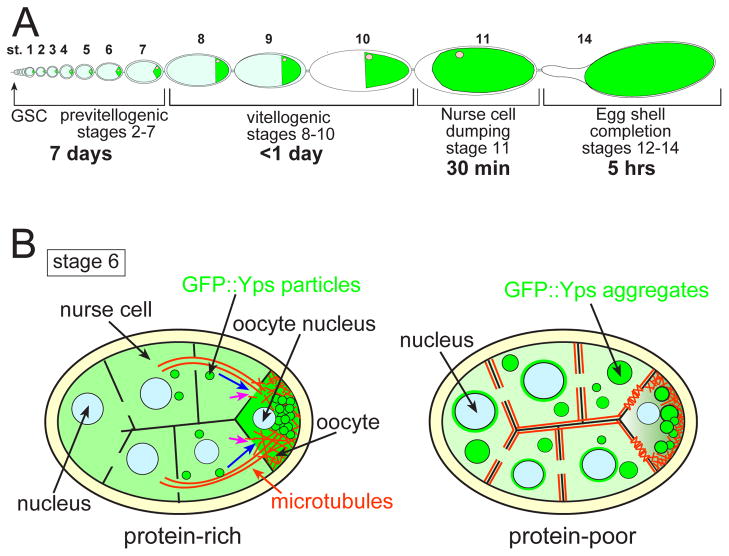
The maturation of animal oocytes is highly sensitive to nutrient availability. During Drosophila oogenesis, a prominent metabolic checkpoint occurs at the onset of yolk uptake (vitellogenesis): under nutrient stress, egg chambers degenerate by apoptosis. To investigate additional responses to nutrient deprivation, we studied the intercellular transport of cytoplasmic components between nurse cells and the oocyte during previtellogenic stages. Using GFP protein-traps, we showed that Ypsilon Schachtel (Yps), a putative RNA binding protein, moved into the oocyte by both microtubule (MT)-dependent and -independent mechanisms, and was retained in the oocyte in a MT-dependent manner. These data suggest that oocyte enrichment is accomplished by a combination of MT-dependent polarized transport and MT-independent flow coupled with MT-dependent trapping within the oocyte. Under nutrient stress, Yps and other components of the oskar ribonucleoprotein complex accumulated in large processing bodies in nurse cells, accompanied by MT reorganization. This response was detected as early as 2h after starvation, suggesting that young egg chambers rapidly respond to nutrient stress. Moreover, both Yps aggregation and MT reorganization were reversed with re-feeding of females or the addition of exogenous insulin to cultured egg chambers. Our results suggest that egg chambers rapidly mount a stress response by altering intercellular transport upon starvation. This response implies a mechanism for preserving young egg chambers so that egg production can rapidly resume when nutrient availability improves.


Figures

Fig. 1
Fig. 1. The expression patterns of oocyte-enriched proteins
(A) A schematic drawing of an ovariole from germarium to stage 8. Vitellogenesis (yolk uptake) starts at stage 8. GFP distributions from protein-trap lines (B, E, H, K, N, Q, and T) and mRNA localizations of GFP-trapped genes detected by RNA in situ hybridization (antisense probes: C, F, I, L, O, R, and U; sense probes: D, G, J, M, P, S, and V). (B–D) Ypsilon schachtel (Yps), (E–G) IGF-II mRNA binding protein (Imp), and (H–J) Eukaryotic initiation factor 4E (eIF4E), (K–M) Belle (Bel), (N–P) Squid (Sqd), (Q–S) Growl, and (T–V) Alan Shepard (Shep). Bars: (B, E, H, K, N, Q, and T) 10 μm; (C, D, F, G, I, J, L, M, O, P, R, S, U, and V) 50 μm.
Fig. 2
Fig. 2. Live imaging of young egg chambers in early oogenesis
(A and B) An ovariole expressing GFP::Yps was cultured in Schneider’s Drosophila medium containing 0.2 mg/ml insulin. GFP::Yps was enriched in the oocyte during stages 1–6 (blue arrows). A double-headed yellow arrow indicates the length of a stage-5 egg chamber at t = 0 (A), and a yellow arrow plus a green arrow indicate its length after 2 hrs (B) (C) The areas of oocytes after 2 hrs of incubation with or without insulin. The oocyte area expanded more in egg chambers cultured in insulin-containing medium (gray bars) than in control medium (white bars). Asterisks show statistical significance (t-test, p<0.05). 10–20 egg chambers were analyzed in each stage from 3 independent experiments. (D–F) GFP::Yps particles form in nurse cells during stages 6–8. Few particles were detected at stage 6 (D, a yellow arrow), and then more were detected at stage 7 (E, yellow arrows) and stage 8 (F, yellow arrows). (G–I) The distribution of microtubules (MTs) was visualized with GFP::tubulin. MT bundles between nurse cells and the oocyte were most prominent at stage 6 (yellow arrows in G) and were less detected at stage 7 (H). At stage 8, most MTs were reorganized to the oocyte and long MT tracks were almost lost between nurse cells and the oocyte (I). (J and K) The mean size of individual particles and the total volume of particles increased during stages 6–8. Asterisks show statistical significance (t-test, p<0.05). 10 egg chambers were analyzed in each stage. (L and M) Overexpression of N-terminal half of Yps fused to mRFP (YpsN::mRFP, magenta) showed Yps-containing particles associated with MTs extending the ring canal during stage 6. Full-length Yps behaved similarly (data not shown). MTs were labeled with GFP::tubulin (green). Blue arrowheads indicate the rim of ring canal between a nurse cell and the oocyte. 4 time-lapse images taken at 5-second intervals are shown to the right. Arrowheads and arrows indicate individual particles that were moving along the MT toward the oocyte. See also Movie S1. Bars, 10 μm.
Fig. 3
Fig. 3. FLIP analysis reveals intercellular cytoplasmic movements between nurse cells and the oocyte
A schematic drawing of egg chambers with the regions of interest color coded: oocyte (red), neighboring nurse cells (blue and yellow), anterior nurse cell (green), and adjacent egg chamber (purple). Each color corresponds to lines of graphs in B. (B) Fluorescence loss in photobleaching (FLIP) analysis was performed with egg chambers expressing Dendra2 and GFP protein-trap lines. The level of fluorescence intensities (the Y-axis) after each photobleach was measured over time (the X-axis) with or without the MT depolymerizing drug, colchicine. The photobleach by laser scanning was performed every 3 minutes. (a–e) Dendra2, (f–j) GFP::Yps, (k–o) GFP::RpL30, (p–u) GFP::Pdi. Representative images before photobleach are shown in the left column. Membrane was labeled with FM4-64 (magenta). Each graph was obtained with 10 egg chambers at stage 6/7 from 3 independent experiments. Bar, 10 μm.
Fig. 4
Fig. 4. The localization of GFP::Yps, but not GFP::Shep was affected by colchicine treatment
Stage-6 egg chambers were incubated in culture medium without (control: A, C–E) or with 50 μg/ml colchicine (B, F–H) for 1 hr. GFP::Yps was enriched in the oocyte (A and C). When MTs were disrupted, GFP::Yps mislocalized in nurse cells and made large aggregates in cytoplasm (arrows in B and F). See also Movie S2. In contrast, the distribution of GFP::Shep was not detectably affected by colchicine (D and G). (E and H) Control and disrupted MTs were visualized by GFP::tubulin. Bars, 10 μm.
Fig. 5
Fig. 5. Previtellogenic egg chambers respond to amino acid starvation
(A) A pair of ovaries from a well-fed female. (B) Ovaries from a “starved” female deprived of protein-rich food for 5 days. (C) The DIC image of an ovariole from a starved female. Although apoptosis occurs after stage 8 (arrows), previtellogenic egg chambers are retained (red box). (D–I) The GFP::Yps fluorescence and DIC images of stage 6 (D and G), stage 7 (E and H), and stage 8 (F and I) egg chambers in the protein-poor condition for 24 hrs. GFP::Yps accumulated in the perinuclear regions and made large aggregates in nurse cells (yellow arrows). (J and K) The mean size of individual particles and the total volume of particles in the protein-rich (gray bars) and the protein-poor condition for 1 day (white bar). Asterisks indicate the statistical significance (t-test, p<0.05). 10 egg chambers were analyzed in each stage. (L and M) oskarMS2/MS2-GFP accumulated aberrantly in nurse cells of stage-6 egg chambers in the protein-poor condition for 24 hrs (yellow arrows). (N–R) GFP::Yps aggregates colocalized with P-body markers (yellow arrows in N–P) but not a stress granule marker or an autolysosome marker (blue arrows in Q and R). Green is GFP::Yps, while magenta is Dcp1 (N), Pcm (O), eIF4E (P), Stau (Q), and Lysotracker (R). Low-power images are placed in Fig. S5. Bars: (A and B) 0.5 mm; (C) 50 μm; (D–I, L–R) 10μm.
Fig. 6
Fig. 6. Microtubule organization is affected by poor nutrition
Stage-6 egg chambers expressing GFP::tubulin (green) and YpsN::mRFP (magenta) dissected from females in the protein-rich (A–C) or the protein-poor condition for 24 hrs (D–F). In response to the protein-poor condition, YpsN::mRFP particles increased in nurse cells (arrows in D). Strikingly, GFP::tubulin showed a major shift in distribution from cytoplasmic MTs toward distinct cortical enrichment in nurse cells (arrowheads in E and F). (G) A quantitative analysis of MT distribution at nurse cell boundaries. The profiles of fluorescence intensities of GFP::tubulin were plotted within 5 μm distance from boundaries in the protein-rich (circle) and the protein-poor condition for 24 hrs (square). The position of membrane was normalized with FM4-64 (magenta). Nearly 40 boundaries from 30 egg chambers were analyzed in each condition. Asterisks show statistical significance (student t-test, p<0.05). Bar, 10 μm.
Fig. 7
Fig. 7. GFP::Yps aggregation and MT reorganization are reversible
(A and B) GFP::Yps aggregates were detected in nurse cells of a stage-7 egg chamber in the protein-poor condition for 24 hrs. When females were starved for 24 hrs and then resupplied with protein-rich food for 24 hrs, GFP::Yps aggregates decreased (arrows). (C) The temporal profile of GFP::Yps aggregate formation in stage-6 egg chambers. The X-axis indicates time after starvation and after resupply of protein-rich food. The Y-axis represents the percentage of nurse cell cytoplasm area occupied by GFP::Yps aggregates. Asterisks indicate statistical significance when the area of GFP::Yps puncta at t = 0 was compared with those in other time points (2-sample Z-test for the proportion, p<0.05). 10–20 egg chambers were analyzed in each time point. (D–G) Egg chambers expressing YpsN::mRFP and GFP::tubulin were taken from females starved for 24 hrs and cultured in the medium with DMSO (vehicle: D and F) or 0.2 mg/ml insulin (E and G). Images were taken immediately after dissection (D and E) and after 1-hr incubation (F and G). Note that MTs are less prominent at the cortical regions (arrowheads) and the number of GFP::Yps aggregates was reduced (arrows) in culture with insulin. Bars, 10 μm.
Fig. 8
Fig. 8. A model of Drosophila egg chamber responding to nutrient stress
(A) A schematic drawing of oogenesis. Green indicates oocytes. Development from germline stem cell (GSC) through stage 7 takes about 7 days, during which oocyte volume increases 55-fold. During the final day of oogenesis, oocyte volume increases more rapidly another 1,600 fold due to yolk uptake (stages 8–10, vitellogenesis) and the transfer of all remaining nurse cell cytoplasm to the oocyte (stage 11, nurse cell dumping). The eggshell forms in 5 hrs (stages 12–14). Thus, previtellogenic development requires the highest time investment, while the last day of oogenesis carries the higher metabolic cost. (B) Our working model. In the presence of protein-rich food, GFP::Yps-containing particles are directionally transported (blue arrows) from nurse cells to the oocyte along MT bundles (orange lines) during stage 6. A portion of GFP::Yps moves to the oocyte by diffusion (pink arrows). MTs are required for Yps to be retained in the oocyte. In the presence of protein-poor food, MTs shift toward the cortical region of nurse cells and polarized transport is disrupted. GFP::Yps assembles into aggregates and also accumulates in the perinuclear regions of nurse cells.

References

    1. Anderson P, Kedersha N. Stress granules: the Tao of RNA triage. Trends Biochem Sci. 2008;33:141–50. - PubMed
    1. Anderson P, Kedersha N. RNA granules: post-transcriptional and epigenetic modulators of gene expression. Nat Rev Mol Cell Biol. 2009;10:430–6. - PubMed
    1. Ashburner M. Drosophila. Cold Spring Harbor Laboratory; Cold Spring Harbor, N.Y: 1989.
    1. Bohrmann J, Biber K. Cytoskeleton-dependent transport of cytoplasmic particles in previtellogenic to mid-vitellogenic ovarian follicles of Drosophila: time-lapse analysis using video-enhanced contrast microscopy. J Cell Sci. 1994;107(Pt 4):849–58. - PubMed
    1. Brengues M, Teixeira D, Parker R. Movement of eukaryotic mRNAs between polysomes and cytoplasmic processing bodies. Science. 2005;310:486–9. - PMC - PubMed

Publication types

LinkOut - more resources