. 2011 May 17;20(5):597-609.
doi: 10.1016/j.devcel.2011.04.008.

Genome-wide analysis of simultaneous GATA1/2, RUNX1, FLI1, and SCL binding in megakaryocytes identifies hematopoietic regulators

Affiliations

Genome-wide analysis of simultaneous GATA1/2, RUNX1, FLI1, and SCL binding in megakaryocytes identifies hematopoietic regulators

Marloes R Tijssen et al. Dev Cell. .

Abstract

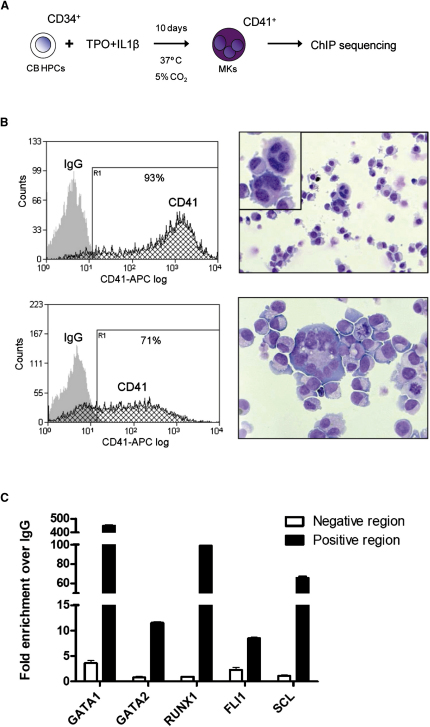
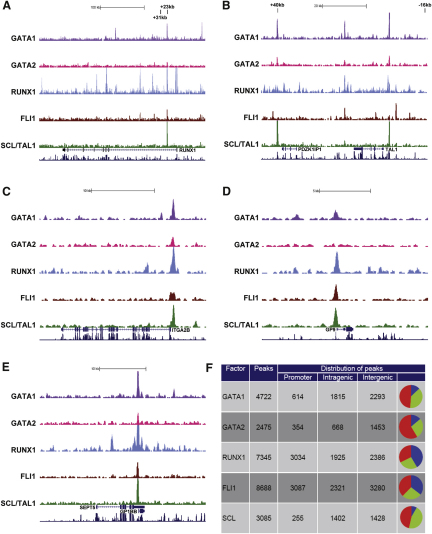
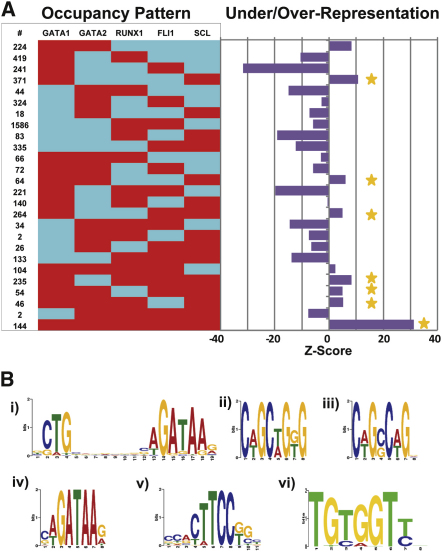
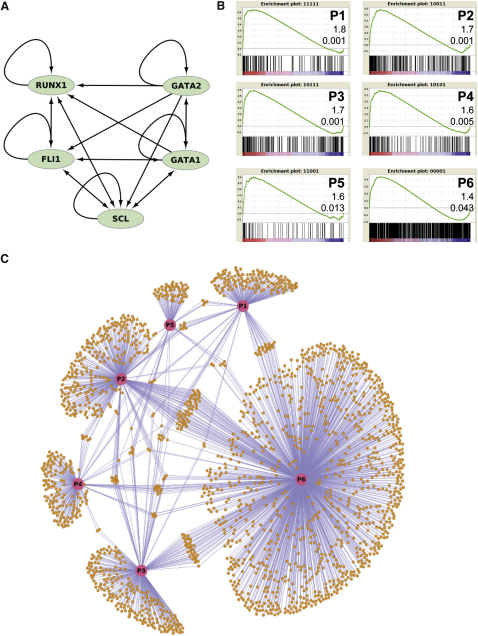
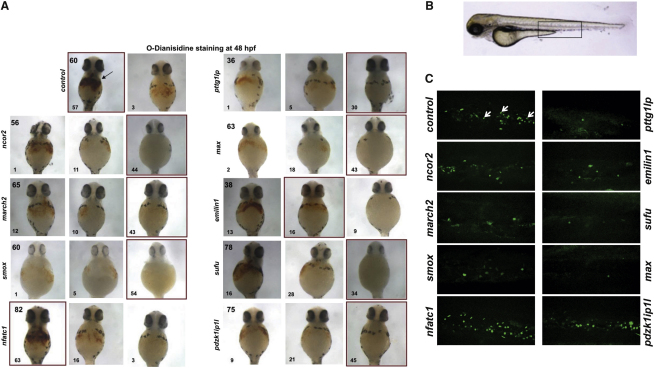
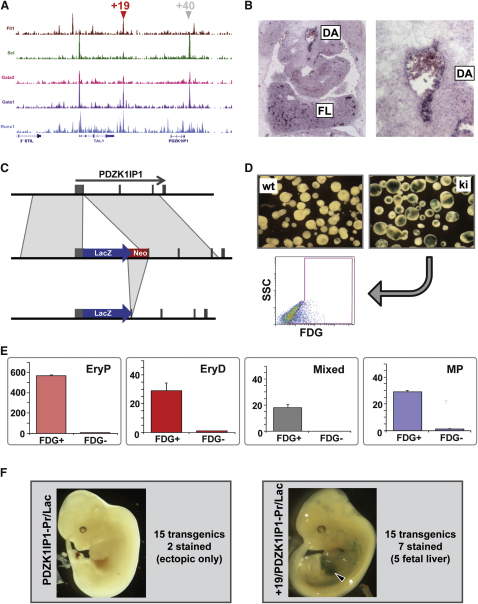
Hematopoietic differentiation critically depends on combinations of transcriptional regulators controlling the development of individual lineages. Here, we report the genome-wide binding sites for the five key hematopoietic transcription factors--GATA1, GATA2, RUNX1, FLI1, and TAL1/SCL--in primary human megakaryocytes. Statistical analysis of the 17,263 regions bound by at least one factor demonstrated that simultaneous binding by all five factors was the most enriched pattern and often occurred near known hematopoietic regulators. Eight genes not previously appreciated to function in hematopoiesis that were bound by all five factors were shown to be essential for thrombocyte and/or erythroid development in zebrafish. Moreover, one of these genes encoding the PDZK1IP1 protein shared transcriptional enhancer elements with the blood stem cell regulator TAL1/SCL. Multifactor ChIP-Seq analysis in primary human cells coupled with a high-throughput in vivo perturbation screen therefore offers a powerful strategy to identify essential regulators of complex mammalian differentiation processes.


Figures

Figure 1
Figure 1
GATA2, RUNX1, FLI1, and SCL Bind to the RUNX1 +23 and GATA1 to the SCL +40 Enhancer in Primary Megakaryocyte Cultures (A) Cord blood CD34+ hematopoietic progenitor cells were differentiated into CD41+ MKs using a 10 day culture in serum-free medium containing TPO and IL-1β. Subsequently ChIP for GATA1, GATA2, RUNX1, FLI1, and SCL was performed. (B) After culture, 71%–93% of cells were CD41+ as determined by flow cytometry (IgG is depicted in gray and CD41 stain in black). A cytospin and modified Wright's stain revealed the presence of pro-MKs with nuclear separation in between megakaryoblasts. (C) ChIP material was validated by real-time PCR using primer pairs for regions known to be bound (positive region) or not bound (negative region). For GATA2, RUNX1, FLI1, and SCL, the RUNX1 intron 1 +23 enhancer was used as a positive region with the RUNX1 +31kb as corresponding negative region. For GATA1, the SCL +40 enhancer was used as a positive region with the SCL −16 as negative region (mean + SD; see Supplemental Experimental Procedures for details).
Figure 2
Figure 2
GATA1, GATA2, RUNX1, FLI1, and SCL Binding to the Human Megakaryocyte Genome (A–E) Raw ChIP-Seq read data was transformed into density plots and displayed in the UCSC genome browser above the tracks for gene structure and vertebrate homology. The vertical viewing range was set at 0–50. Black vertical bars show the location of the PCR primers used to validate the ChIP material. Shown here are the loci RUNX1 (A), SCL/TAL1 (B), ITGA2B (CD41) (C), GP9 (CD42a) (D), and GP1BB (CD42c) (E). (F) Each peak was allocated to be either within a promoter, intragenic, or intergenic region. The pie chart shows the distribution of the peaks across those three categories (blue, green, and red, respectively). See also Figure S1.
Figure 3
Figure 3
Analysis of Combinatorial Binding Identifies Prevalent Patterns and Suggests Indirect Recruitment of SCL and RUNX1 (A) The number of peaks for all 26 combinations involving binding of two or more factors are shown on the left of the figure (red = bound, blue = not bound). Z scores on the right indicate significance of deviation between observed and expected instances for all 26 binding patterns. Seven of eight combinations containing GATA1 and SCL were overrepresented (marked with a yellow star). (B) De novo motif discovery on sequences bound only by GATA1 and SCL recovers a typical SCL/GATA1 composite binding motif (i), the SCL binding E-box motif (ii), and a motif resembling an E-box (iii). All regions bound by GATA1 and SCL plus one or more of the other factors, recovered GATA, ETS, and RUNX consensus sequences (iv, v, and vi, respectively). See also Tables S1 and S2 and Figure S2.
Figure 4
Figure 4
A Regulatory Network Model for Megakaryocyte-Specific Expression (A) GATA1, GATA2, RUNX1, FLI1, and SCL form a densely connected core circuit replete with positive feedback loops. (B) Gene set enrichment analysis (GSEA) shows highly significant enrichment for expression in MKs in 6 of the 31 possible combinatorial binding patterns (see Table S3 for full results). Shown are plots of the running sum for the genes regulated by these six patterns in relation to all genes ranked for expression in MKs compared to six other human blood cell types (Watkins et al., 2009) (CD4, CD8, CD14, CD19, CD56, CD66b, and erythroblasts). The six occupancy patterns significant in GSEA are labeled P1 to P6 for ease of representation in (C). The normalized enrichment score and false discovery rate q value are also shown. (C) A regulatory network model for gene expression in MKs regulated by the six occupancy patterns showing significant correlation by GSEA. Shown are the links to downstream target genes based on peak-to-gene mapping for the patterns P1–P6 (B). Although some genes are regulated by multiple patterns, most downstream effector genes are controlled by a single node. See also Table S3 and Figure S3.
Figure 5
Figure 5
In Vivo Morpholino Screen in Zebrafish Identifies Eight Regulators of Hematopoiesis (A) MOs were injected into one-cell stage embryos and number of erythrocytes assessed with o-dianisidine staining. For eight genes, injection of MOs resulted in a reduced number of blood cells in circulation at 48 hr postfertilization (hpf). For clarity representative images illustrating three different phenotypes (unaffected [left], mild [middle], and severe [right]) are shown with the number of embryos in each group indicated in the lower, left corner. The number in the upper left corner of the very left image shows the total number of embryos used in each experiment. The predominant phenotype is framed in red. Black arrow indicates hemoglobin staining in the control. (B) Wild-type zebrafish embryo at 72 hpf. Confocal images presented in (C) were taken of the caudal hematopoietic tissue, indicated by the boxed region. (C) MOs were injected into the one-cell stage transgenic Tg(cd41:EGFP) zebrafish embryos and assayed for their effect on the number of presumed hematopoietic stem cells (cd41low) and thrombocytes (cd41high; white arrows) at 72 hpf. For march2 (n = 44), max (n = 63), smox (n = 60), pttg1lp (n = 50), emilin1 (n = 65), and sufu (n = 65), a severe decrease of cd41 positive cells was observed. Ncor2 (n = 53) depletion resulted in a mild phenotype, and pdzk1ip1l (n = 49) and nfatc1 (n = 60) MO injected embryos showed no phenotype. See also Tables S4–S7 and Figure S4.
Figure 6
Figure 6
PDZK1IP1 Shares Transcriptional Enhancer Elements with the Hematopoietic Master Regulator SCL (A) ChIP-Seq results (as for Figure 2) across the human SCL/PDZK1IP1 gene locus with the location of the +19 and +40 enhancer elements indicated by arrowheads. (B) Pdzk1ip1 is expressed in the fetal liver (FL) and dorsal aorta (DA) region of midgestation mouse embryos. Shown are the results from in situ hybridization experiments using transverse sections of day 12.5 mouse embryos with a magnified view of the dorsal aorta on the right hand side. (C) Targeting of a lacZ reporter gene into the 5′UTR of mouse Pdzk1ip1 in ESCs. The neo selection marker was flanked by loxP sites and removed using Cre-mediated recombination. (D) Pdzk1ip1 lacZ knockin ESCs express lacZ after differentiation into embryoid bodies. The top section shows day 6 embryoid bodies stained for lacZ using the chromogenic substrate X-Gal with wild-type (wt) cells on the left and Pdzk1ip1 knockin cells (ki) on the right. The bottom part shows flow cytometry analysis using the fluorogenic lacZ substrate FDG with approximately 25% of Pdzk1ip1 knockin cells expressing the lacZ reporter (FDG, x axis; Side Scatter SSC, y axis). (E) Hematopoietic colony forming activity is confined to Pdzk1ip1 expressing cells in ESC differentiation assays. Pdzk1ip1 expressing cells were purified by flow cytometry and analyzed for colony forming ability. Shown from left to right are colony numbers per 100,000 cells for primitive erythroid (EryP), definitive erythroid (EryD), mixed lineage (Mixed), and macrophage colonies (MP) (mean + SD). (F) The +19 enhancer drives expression to the fetal liver in transgenic mice when fused to the Pdzk1ip1 promoter. Shown on the left is a representative E12.5 transgenic embryo carrying the Pdzk1ip1 promoter fused to the lacZ reporter gene with no observable staining. Shown on the right is a representative transgenic embryo for the Pdzk1ip1 promoter fused to the +19 enhancer with readily identifiable staining in the fetal liver (arrowhead). See also Figure S5.

References

    1. Adolfsson J., Mansson R., Buza-Vidas N., Hultquist A., Liuba K., Jensen C.T., Bryder D., Yang L., Borge O.J., Thoren L.A. Identification of Flt3+ lympho-myeloid stem cells lacking erythro-megakaryocytic potential a revised road map for adult blood lineage commitment. Cell. 2005;121:295–306. - PubMed
    1. Anderson K.P., Crable S.C., Lingrel J.B. Multiple proteins binding to a GATA-E box-GATA motif regulate the erythroid Kruppel-like factor (EKLF) gene. J. Biol. Chem. 1998;273:14347–14354. - PubMed
    1. Bailey T.L., Elkan C. Fitting a mixture model by expectation maximization to discover motifs in biopolymers. Proc. Int. Conf. Intell. Syst. Mol. Biol. 1994;2:28–36. - PubMed
    1. Boyle A.P., Davis S., Shulha H.P., Meltzer P., Margulies E.H., Weng Z., Furey T.S., Crawford G.E. High-resolution mapping and characterization of open chromatin across the genome. Cell. 2008;132:311–322. - PMC - PubMed
    1. Bryne J.C., Valen E., Tang M.-H.E., Marstrand T., Winther O., da Piedade I., Krogh A., Lenhard B., Sandelin A. JASPAR, the open access database of transcription factor-binding profiles: new content and tools in the 2008 update. Nucleic Acids Res. 2008;36:D102–D106. - PMC - PubMed

Publication types

MeSH terms

Substances

Associated data