. 2011 Oct;30(10):1829-40.
doi: 10.1109/TMI.2011.2154385. Epub 2011 May 12.

PopTract: population-based tractography

Affiliations

PopTract: population-based tractography

Pew-Thian Yap et al. IEEE Trans Med Imaging. 2011 Oct.

Abstract

White matter fiber tractography plays a key role in the in vivo understanding of brain circuitry. For tract-based comparison of a population of images, a common approach is to first generate an atlas by averaging, after spatial normalization, all images in the population, and then perform tractography using the constructed atlas. The reconstructed fiber trajectories form a common geometry onto which diffusion properties of each individual subject can be projected based on the corresponding locations in the subject native space. However, in the case of high angular resolution diffusion imaging (HARDI), where modeling fiber crossings is an important goal, the above-mentioned averaging method for generating an atlas results in significant error in the estimation of local fiber orientations and causes a major loss of fiber crossings. These limitatitons have significant impact on the accuracy of the reconstructed fiber trajectories and jeopardize subsequent tract-based analysis. As a remedy, we present in this paper a more effective means of performing tractography at a population level. Our method entails determining a bipolar Watson distribution at each voxel location based on information given by all images in the population, giving us not only the local principal orientations of the fiber pathways, but also confidence levels of how reliable these orientations are across subjects. The distribution field is then fed as an input to a probabilistic tractography framework for reconstructing a set of fiber trajectories that are consistent across all images in the population. We observe that the proposed method, called PopTract, results in significantly better preservation of fiber crossings, and hence yields better trajectory reconstruction in the atlas space.


Figures

Fig. 1
Fig. 1
Smearing of the ODF. (a) The original ODF. (b) The ODF resulting from the averaging out-of-alignment ODFs simulated by perturbing the original ODF with slight random rotations.
Fig. 2
Fig. 2
The Watson distribution is more concentrated around the mean orientation μ when k has a larger value: (a) κ = 4, typical for a gray matter voxel, (b)κ = 15, typical for a voxel in the corpus callosum. Dark red indicates high probability values and dark blue indicates otherwise.
Fig. 3
Fig. 3
Orientation sorting. Note that, prior to sorting, the ordering of some of the red orientations and blue orientations is inconsistent. This is resolved by using the sorting algorithm described in Section II-A3. (a) Before sorting. (b) After sorting.
Fig. 4
Fig. 4
Fiber path is represented by a train of vectors, v(t), with step length s.
Fig. 5
Fig. 5
Synthesized ODFs perturbed with noise at different SNR levels. (a) Ground Truth, (b) SNR = 16, (c) SNR = 8, (d) SNR = 4, (e) SNR = 2.
Fig. 6
Fig. 6
Estimation of population-based orientations using different schemes. (a) Ground truth. (b) Average atlas. (c) PopTract.
Fig. 7
Fig. 7
Orientational dicrepancy between the estimated orientations and the ground truth orientations under different rotation angles and signal-to-noise ratios. Each bar indicates the mean value, and the error bar indicates the corresponding standard error. The asterisks (*) mark differences that are statistically significant (paired t-test, p = 0.05).
Fig. 8
Fig. 8
Orientational dicrepancy between the estimated orientations and the ground truth orientations under different rotation angles and signal-to-noise ratios. Each bar indicates the mean value, and the error bar indicates the corresponding standard error. The asterisks (*) mark differences that are statistically significant (paired t-test, p < 0.05).
Fig. 9
Fig. 9
Fiber crossings. A significant loss of crossings can be observed for the average atlas method. (a) Template. (b) Average atlas. (c) PopTract.
Fig. 10
Fig. 10
ODF ratios. Higher values indicate greater relative strength of the second orientation. Each bar indicates the mean value, and the error bar indicates the corresponding standard error. Error bars are shown only for “individual images,” since it is the only case where measurement variability can be computed based on a number of images.
Fig. 11
Fig. 11
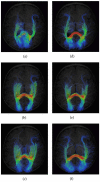
Fiber trajectory reconstruction of the (a) forceps minor, (b) forceps major, (c) cingulum bundle, and (d) corticospinal tract. The results given by the average atlas method and PopTract are shown on the left and right, respectively. The coloring indicates the probability of finding a fiber at a specific spatial location. Dark red indicates a high probability that a particular location is traversed by fibers; dark blue indicates otherwise.
Fig. 12
Fig. 12
Fiber trajectory reconstruction of the forceps major of the infants at the one month (a)–(c) and one year (d)–(f) time points. The coloring indicates the probability of finding a fiber at a specific spatial location. Dark red indicates a high probability that a particular location is traversed by fibers, and dark blue indicates otherwise. (a) Template (one month). (b) Average atlas (one month). (c) PopTract (one month). (d) Template (one year). (e) Average atlas (one year). (f) PopTract(one year).
Fig. 13
Fig. 13
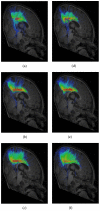
Fiber trajectory reconstruction of the cingulum bundle of the infants at the (a)–(c) one month and (d)–(f) one year time points. The coloring indicates the probability of finding a fiber at a specific spatial location. Dark red indicates a high probability that a particular location is traversed by fibers, and dark blue indicates otherwise. (a) Template (one month). (b) Average atlas (one month). (c) PopTract (one month). (d) Template (one year). (e) Average atlas (one year). (f) PopTract (one year).

References

    1. Alexander DC. Visualization and Processing of Tensor Fields. Springer; Berlin, Germany: 2006. pp. 83–106.
    1. Yap P-T, Wu G, Shen D. Human brain connectomics: Networks, techniques, and applications. IEEE Signal Process. Mag. 2010 Jul;27(4):131–134.
    1. Wee C-Y, Yap P-T, Li W, Denny K, Browndyke JN, Potter GG, Welsh-Bohmer KA, Wang L, Shen D. Enriched white matter connectivity networks for accurate identification of MCI patients. NeuroImage. 2010;54(3):1812–1822. - PMC - PubMed
    1. Ciccarelli O, Catani M, Johansen-Berg H, Clark C, Thompson A. Diffusion-based tractography in neurological disorders: Concepts, applications, and future developments. Lancet Neurol. 2008;7(8):715–727. - PubMed
    1. Kubicki M, McCarley R, Westin C-F, Park H-J, Maier S, Kikinis R, Jolesz FA, Shenton ME. A review of diffusion tensor imaging studies in schizophrenia. J. Psychiatric Res. 2007;41:15–30. - PMC - PubMed

Publication types