. 2011 Aug;301(2):L187-96.
doi: 10.1152/ajplung.00082.2011. Epub 2011 May 13.

Silencing hyperoxia-induced C/EBPα in neonatal mice improves lung architecture via enhanced proliferation of alveolar epithelial cells

Affiliations

Silencing hyperoxia-induced C/EBPα in neonatal mice improves lung architecture via enhanced proliferation of alveolar epithelial cells

Guang Yang et al. Am J Physiol Lung Cell Mol Physiol. 2011 Aug.

Abstract

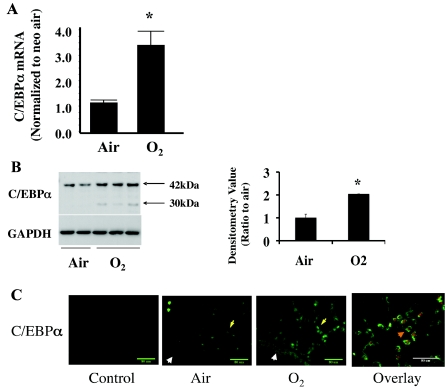
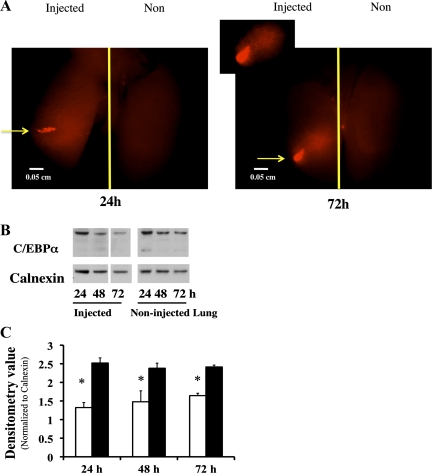
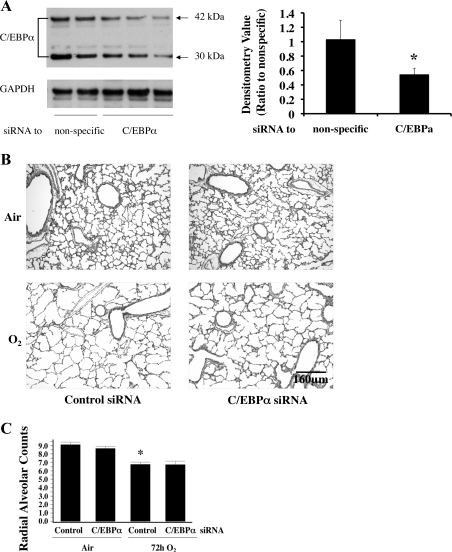
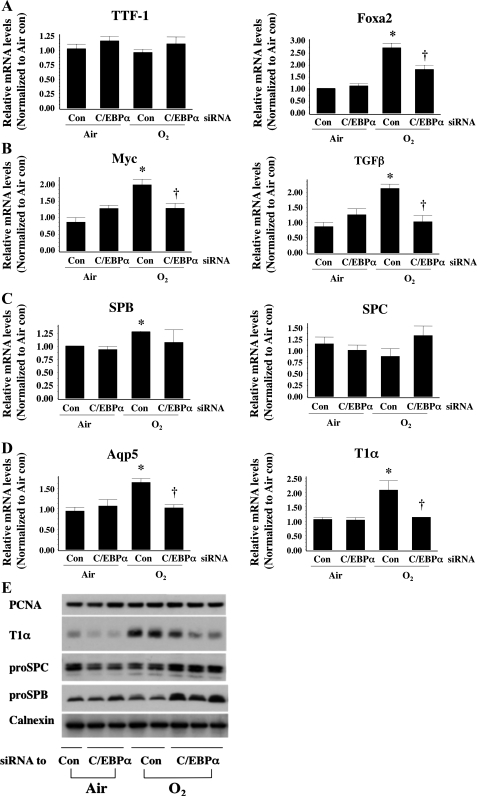
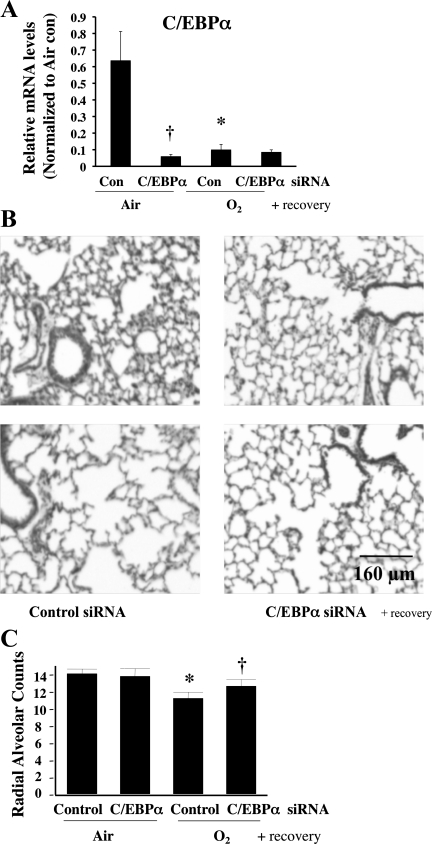
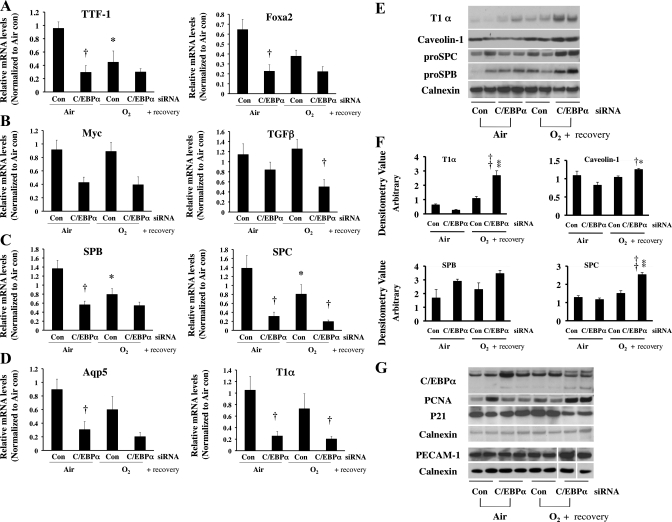
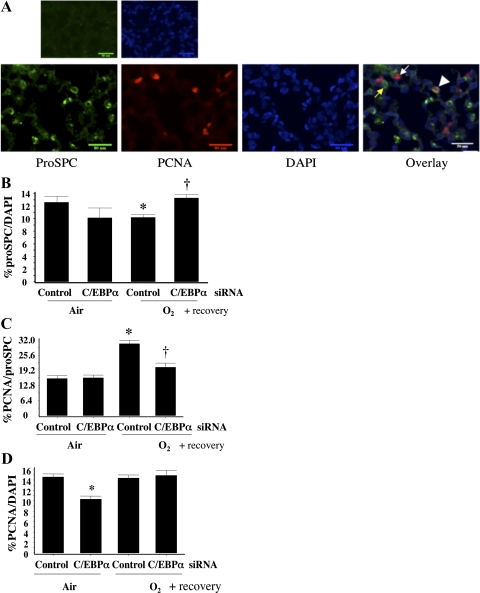
Postnatal lung development requires proliferation and differentiation of specific cell types at precise times to promote proper alveolar formation. Hyperoxic exposure can disrupt alveolarization by inhibiting cell growth; however, it is not fully understood how this is mediated. The transcription factor CCAAT/enhancer binding protein-α (C/EBPα) is highly expressed in the lung and plays a role in cell proliferation and differentiation in many tissues. After 72 h of hyperoxia, C/EBPα expression was significantly enhanced in the lungs of newborn mice. The increased C/EBPα protein was predominantly located in alveolar type II cells. Silencing of C/EBPα with a transpulmonary injection of C/EBPα small interfering RNA (siRNA) prior to hyperoxic exposure reduced expression of markers of type I cell and differentiation typically observed after hyperoxia but did not rescue the altered lung morphology at 72 h. Nevertheless, when C/EBPα hyperoxia-exposed siRNA-injected mice were allowed to recover for 2 wk in room air, lung epithelial cell proliferation was increased and lung morphology was restored compared with hyperoxia-exposed control siRNA-injected mice. These data suggest that C/EBPα is an important regulator of postnatal alveolar epithelial cell proliferation and differentiation during injury and repair.


Figures

Fig. 1.
Fig. 1.
Hyperoxic induction of lung CCAAT/enhancer binding protein-α (C/EBPα) mRNA and its epithelial localization in neonatal (<12-h-old) mouse lung after 72 h of room air (Air) and 95% O2 (O2) exposure. A: C/EBPα mRNA increases in hyperoxia after normalization to room air. B: Western blots of C/EBPα immunoreactive protein levels (left) and densitometric evaluation of 42-kDa C/EBPα (right) in hyperoxia. Blots represent results from 4 experiments. Arrows indicate the 2 isoforms for C/EBPα protein. Values are means ± SE of 3 mice in each group. *P < 0.05 vs. Air. C: immunohistofluorescent staining of hyperoxia-induced C/EBPα in lung epithelial cells. Bronchiolar epithelial cells are indicated by white arrowheads and alveolar epithelial cells by yellow arrows. Overlay shows colocalization (orange arrowhead) of hyperoxia-induced C/EBPα (red staining) and ATP-binding cassette subfamily A member 3 (ABCA3, green staining), a marker of alveolar type II cells.
Fig. 2.
Fig. 2.
Evaluation of small interfering RNA (siRNA) stability and specific target gene inhibition via intrapulmonary injection. A: a Cy3-conjugated siRNA to cyclophilin B (siGLO) was injected into left lung of neonatal mouse, and a fluorescent micrograph was obtained at 24 and 72 h after injections. Arrows indicate injection sites. Inset: focused view of injected area. B: Western blots of C/EBPα protein levels after intrapulmonary injection. Blots represent results from 3 experiments. Only 1 of the 2 samples originally loaded on the gel is shown. Inadequately loaded lanes were omitted (white spaces). C: densitometric evaluation of 42-kDa C/EBPα protein. Values are means ± SE of 3 mice in each group. Open bars, injected left lungs; solid bars, corresponding noninjected right lungs. *P < 0.05 vs. noninjected lungs.
Fig. 3.
Fig. 3.
Evaluation of lung architecture and function after intrapulmonary injection of C/EBPα siRNA into neonatal lung exposed to 72 h of hyperoxia (O2). A: Western blots of C/EBPα protein levels (left) and densitometric evaluation of 42-kDa C/EBPα protein (right) after hyperoxic exposure preceded by injection of nonspecific (Control) or C/EBPα siRNA. Blots represent results from 3 experiments. Values are means ± SE of 4 mice in each group. *P < 0.05 vs. nonspecific. B: hematoxylin-eosin-stained lung sections obtained from A. C: radial alveolar counts (RACs) in lungs of pups obtained from A. Values are means ± SE of 3–5 mice in each group. *P < 0.01 vs. Control in Air.
Fig. 4.
Fig. 4.
mRNA levels of thyroid transcription factor 1 (TTF1) and FoxA2 as markers of lung development (A), myelocytomatosis oncogene (myc) and transforming growth factor-β (TGFβ) as markers of cell differentiation (B), surfactant proteins B and C (SP-B and SP-C) as markers of type II cells (C), and aquaporin 5 (Aqp5) and T1α as markers of type I cells (D) after intrapulmonary injection of C/EBPα siRNA into neonatal lung exposed to 72 h of hyperoxia (O2). Values are means ± SE of 3 mice. *P < 0.05 vs. control siRNA-injected group (Con) in 72-h air exposure (Air). †P < 0.05 vs. Con in O2. E: representative Western blots of protein levels of alveolar type II and type I cell markers, as well as proliferating cell nuclear antigen (PCNA), a general cell proliferation marker.
Fig. 5.
Fig. 5.
Effect of C/EBPα siRNA on lung architecture and RAC in lungs of neonatal mice exposed to hyperoxia and allowed to recover in room air. A: mRNA levels in C/EBPα siRNA-injected lung allowed to recover in room air. Values are means ± SE of 6 animals in each group. *P < 0.05 vs. control siRNA-injected lung (Con) in 72-h air exposure (Air). †P < 0.05 vs. C/EBPα siRNA-injected lung (C/EBPα siRNA) in Air. B: representative hematoxylin-eosin-stained lung sections. C: RAC in control (nonspecific) siRNA- and C/EBPα siRNA-injected lungs after room air recovery. Values are means ± SE of 5 animals in each group. *P < 0.05 vs. Control in Air. †P < 0.05 vs. Control in 72-h O2 exposure (O2).
Fig. 6.
Fig. 6.
mRNA levels of TTF1 and FoxA2 as markers of lung development (A), myc and TGFβ as markers of cell differentiation (B), SP-B and SP-C as markers of type II cells (C), and aquaporin 5 and T1α as markers of type I cells (D) after intrapulmonary injection of C/EBPα siRNA into neonatal lung exposed to 72 h of hyperoxia (O2) and allowed to recover in room air. Values are means ± SE of 6 mice. *P < 0.05 vs. control siRNA-injected group (Con) in 72-h air exposure (Air). †P < 0.05 vs. C/EBPα siRNA-injected group (C/EBPα siRNA) in Air or O2. E: representative Western blots of type I (T1α and caveolin-1) and type II (pro-SP-C and pro-SP-B) cell marker proteins. F: densitometric evaluations of T1α, caveolin-1, pro-SP-B, and pro-SP-C protein levels from 6 lungs in each group. Values are means ± SE of 6 mice. *P < 0.05 vs. C/EBPα siRNA in Air. †P < 0.05 vs. Con in O2. **P < 0.001 vs. C/EBPα siRNA in Air. ††P < 0.001 vs. Con in O2. G: representative Western blots of protein levels of C/EBPα, PCNA (a general cell proliferation marker), p21 (a cell cycle inhibitor protein), and platelet/endothelial cell adhesion marker (PECAM-1, a vascular endothelial cell marker). In PECAM-1 immunoreactive protein evaluations, 3 lanes were omitted because of collapsed wells on acrylamide gel (white spaces). Each blot was normalized to corresponding calnexin protein levels to obviate loading variability.
Fig. 7.
Fig. 7.
Evaluation of type II cell numbers and proliferating type II cells in control siRNA- and C/EBPα siRNA-injected lung after room air recovery. A: immunofluorescent staining of lung slides for pro-SP-C (indicator of type II cells), PCNA (indicator of overall proliferating cells), and 4′,6-diamidino-2-phenylindole (DAPI, indicator of total cells). Overlay shows cells positive for both pro-SP-C- and PCNA. Yellow arrow indicates pro-SP-C-positive cell, white arrow indicates PCNA-positive cell, and arrowhead indicates cell positive for both pro-SP-C and PCNA. B: pro-SP-C-positive cells as percentage of DAPI-positive cells. *P < 0.05 vs. control siRNA-injected lung (Control) in 72-h air exposure (Air). †P < 0.05 vs. Control in 72-h O2 exposure (O2). C: cells positive for both pro-SP-C and PCNA as percentage of DAPI-positive cells. *P < 0.05 vs. Control in Air. †P < 0.05 vs. Control in O2. D: PCNA-positive cells as percentage of DAPI-positive cells. Ten high-power fields were counted on each lung section at the distal alveolar epithelial level. *P < 0.05 vs. Control in Air. Values were obtained from an average of 3 lungs and an average of 10 high-power fields per lung.

Similar articles

Cited by

References

    1. Alejandre-Alcazar MA, Kwapiszewska G, Reiss I, Amarie OV, Marsh LM, Sevilla-Perez J, Wygrecka M, Eul B, Kobrich S, Hesse M, Schermuly RT, Seeger W, Eickelberg O, Morty RE. Hyperoxia modulates TGF-β/BMP signaling in a mouse model of bronchopulmonary dysplasia. Am J Physiol Lung Cell Mol Physiol 292: L537–L549, 2007 - PubMed
    1. Andreyev AY, Shen Z, Guan Z, Ryan A, Fahy E, Subramaniam S, Raetz CR, Briggs S, Dennis EA. Application of proteomic marker ensembles to subcellular organelle identification. Mol Cell Proteomics 9: 388–402, 2010 - PMC - PubMed
    1. Basseres DS, Levantini E, Ji H, Monti S, Elf S, Dayaram T, Fenyus M, Kocher O, Golub T, Wong KK, Halmos B, Tenen DG. Respiratory failure due to differentiation arrest and expansion of alveolar cells following lung-specific loss of the transcription factor C/EBPα in mice. Mol Cell Biol 26: 1109–1123, 2006 - PMC - PubMed
    1. Boggaram V. Regulation of surfactant protein gene expression by hyperoxia in the lung. Antioxid Redox Signal 6: 185–190, 2004 - PubMed
    1. Bonikos DS, Bensch KG, Ludwin SK, Northway WH., Jr Oxygen toxicity in the newborn. The effect of prolonged 100% O2 exposure on the lungs of newborn mice. Lab Invest 32: 619–635, 1975 - PubMed

Publication types

MeSH terms

Substances

LinkOut - more resources