. 2012 Jan;22(1):99-111.
doi: 10.1093/cercor/bhr088. Epub 2011 May 13.

Resting-state functional connectivity of the medial superior frontal cortex

Affiliations

Resting-state functional connectivity of the medial superior frontal cortex

Sheng Zhang et al. Cereb Cortex. 2012 Jan.

Abstract

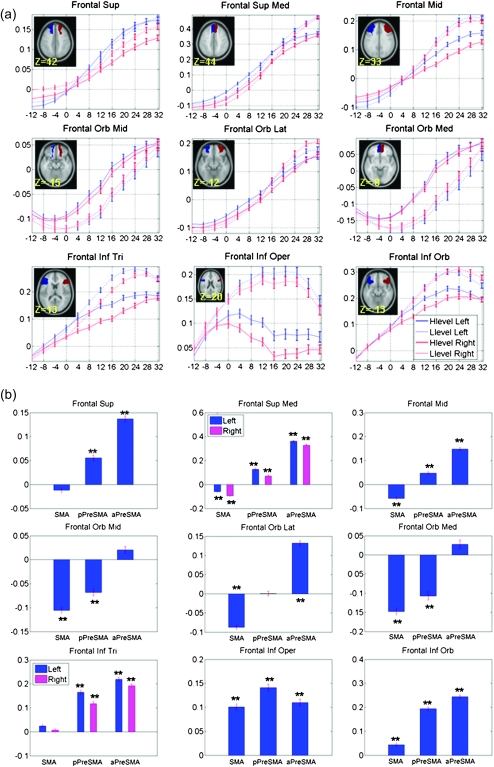
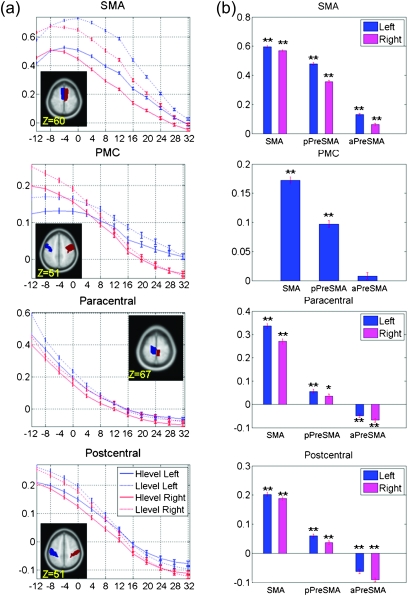
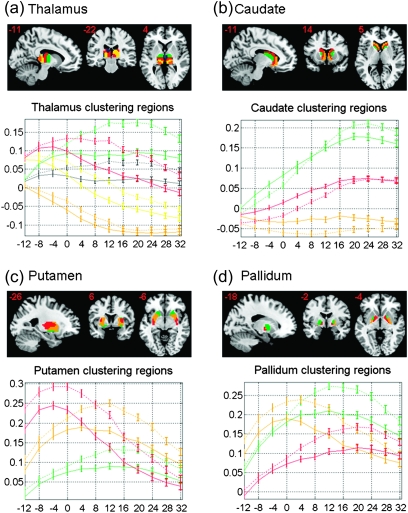
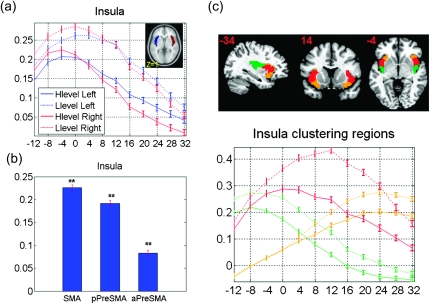
The medial superior frontal cortex (SFC), including the supplementary motor area (SMA) and presupplementary motor area (preSMA), is implicated in movement and cognitive control, among other functions central to decision making. Previous studies delineated the anatomical boundaries and functional connectivity of the SMA. However, it is unclear whether the preSMA, which responds to a variety of behavioral tasks, comprises functionally distinct areas. With 24 seed regions systematically demarcated throughout the anterior and posterior medial SFC, we examined here the functional divisions of the medial SFC on the basis of the "correlograms" of resting-state functional magnetic resonance imaging data of 225 adult individuals. In addition to replicating segregation of the SMA and posterior preSMA, the current results elucidated functional connectivities of anterior preSMA-the most anterior part of the medial SFC. In contrast to the caudal medial SFC, the anterior preSMA is connected with most of the prefrontal but not with somatomotor areas. Overall, the SMA is strongly connected to the thalamus and epithalamus, the posterior preSMA to putamen, pallidum, and subthalamic nucleus, and anterior preSMA to the caudate, with the caudate showing significant hemispheric asymmetry. These findings may provide a useful platform for future studies to investigate frontal cortical functions.


Figures

Figure 1.
Figure 1.
Placement of the 24 seeds. The medial SFC was seeded at 24 coordinates along 2 separate parallel arrays each 10 and 20 mm below the margin of the brain at x = 0 of the standard 152 brain MNI template.
Figure 2.
Figure 2.
Group results of voxelwise functional connectivity of the medial SFC, as defined by each of the 24 high (H)- and low (L)-level seeds. The H4/L4 seeds are centered at y = 0. Positive (warm color) and negative (cold color) correlations were superimposed on 9 axial slices (Z = −15, −5, 5, 15, 25, 35, 45, 55, 65 mm) of a structural image. n = 225, P < 0.05, corrected for familywise error (FWE) of multiple comparisons.
Figure 3.
Figure 3.
(a) Correlation z (mean ± standard error; n = 225) scores between each seed region and 9 prefrontal masks (frontal sup: superior frontal gyrus; front sup med: medial superior frontal gyrus; frontal orb mid: middle part of orbital frontal gyrus; frontal mid: middle frontal gyrus; frontal orb lat: lateral part of orbital frontal gyrus; frontal orb med: medial part of orbital frontal gyrus; frontal inf oper: opercular part of IFG; frontal inf tri: triangular part of IFG; frontal inf orb: orbital part of IFG). The x-axis represents the y coordinate of the center of each seed. Correlations are shown in red and blue, respectively, for right- and left-hemispheric seeds, with solid and dashed lines indicating high- and low-level seeds. (b) Correlation z scores averaged across seed regions comprising SMA, posterior preSMA (pPreSMA), and anterior preSMA (aPreSMA). The results are shown separately for left- and right-hemispheric masks if differences exist (ANOVA, Table 2). Correlation z scores that were significant different from zero were highlighted with **P < 0.0001, uncorrected (for details, see Supplementary Table 1).
Figure 4.
Figure 4.
(a) Correlation z scores (mean ± standard error) between each seed region and 4 somatomotor areas (SMA and PMC). The x-axis represents the y coordinate of the center of each seed. Correlations between each seed region and left- and right-hemispheric masks are shown in red and blue, respectively, with solid and dashed lines indicating high- and low-level seeds. (b) Correlation z scores averaged across seed regions comprising SMA, posterior preSMA (pPreSMA), and anterior preSMA (aPreSMA). The results are shown separately for left- and right-hemispheric masks if differences exist (ANOVA, Table 2). Correlation z scores that were significant different from zero were highlighted with *P < 0.0006 (P < 0.05, corrected for multiple comparisons) and **P < 0.0001, uncorrected (for details, see Supplementary Table 1).
Figure 5.
Figure 5.
(a) Correlation z scores (mean ± standard error) between each seed region and subcortical areas. The x-axis represents the y coordinate of the center of each seed. Correlations between each seed region and left- and right-hemispheric masks are shown in red and blue, respectively, with solid and dashed lines indicating high- and low-level seeds. (b) Correlation z scores averaged across seed regions comprising SMA, posterior preSMA (pPreSMA), and anterior preSMA (aPreSMA). The results are shown separately for left- and right-hemispheric masks if differences exist (ANOVA, Table 2). Correlation z scores that were significant different from zero were highlighted with *P < 0.0006 (P < 0.05, corrected for multiple comparisons) and **P < 0.0001, uncorrected (for details, see Supplementary Table 1).
Figure 6.
Figure 6.
Clustering results of subcortical regions and corresponding z scores (mean ± standard error) between each medial SFC seed region and subcortical clusters. Correlations are represented as error bar across all 225 subjects. The y-axis represents the coordinate of the center of each seed. Solid and dashed line each indicates correlation for high- and low-level seeds. Clusters are distinguished by color (a) thalamus (dorsal medial: blue; anterior: green; posterior middle: yellow; posterior: gold; and anterior middle: red); (b) caudate (ventral posterior: green; dorsal middle: red; and ventral anterior: gold); (c) putamen (ventral anterior: green; dorsal anterior: red; and posterior: red); and (d) pallidum (lateral anterior: green; lateral posterior: gold; and medial: red).
Figure 7.
Figure 7.
Correlation and clustering results of the insula. (a) Correlation z scores between each seed region and the insula. The x-axis represents the y coordinate of the center of each seed. Correlations between each seed region and left- and right-hemispheric masks are shown in red and blue, respectively, with solid and dashed lines indicating high- and low-level seeds. (b) Histograms with error bars of averaged correlation z scores (mean ± standard error) each between SMA, posterior preSMA (pPreSMA), anterior preSMA (aPreSMA) clusters and the insula. Correlation z scores that were significant different from zero were highlighted here with **P < 0.0001, uncorrected, and detailed values can be found in Supplementary Table 1. (c) Clustering results of subcortical regions and corresponding z scores (mean ± standard error) between each medial SFC seed region and insula clusters. Correlations are represented as error bar across all 225 subjects. The y-axis represents the coordinate of the center of each seed. Solid and dashed line each indicates correlation for high- and low-level seeds. Three clusters were represented and different colors demonstrate different clusters for each subcortical region as posterior (green), ventral anterior (gold), and dorsal anterior (red).
Figure 8.
Figure 8.
A summary of functional connectivity of the SMA (red), posterior preSMA (pPreSMA. blue), and anterior preSMA (aPreSMA, green), with gold indicating connectivity with all 3 regions. Positive and negative connectivities are each indicated by solid and dashed line. Abbreviations: frontal sup: superior frontal gyrus; front sup med: medial superior frontal gyrus; frontal orb mid: middle part of orbital frontal gyrus; frontal mid: middle frontal gyrus; frontal orb lat: lateral part of orbital frontal gyrus; frontal orb med: medial part of orbital frontal gyrus; frontal inf oper: opercular part of IFG; frontal inf tri: triangular part of IFG; frontal inf orb: orbital part of IFG; postcentral: postcentral cortex; paracentral: paracentral cortex; EPI: epithalamus.

References

    1. Alexander GE, DeLong MR, Strick PL. Parallel organization of functionally segregated circuits linking basal ganglia and cortex. Annu Rev Neurosci. 1986;9:357–381. - PubMed
    1. Ashburner J, Friston KJ. Nonlinear spatial normalization using basis functions. Hum Brain Mapp. 1999;7:254–266. - PMC - PubMed
    1. Assaf M, Calhoun VD, Kuzu CH, Kraut MA, Rivkin PR, Hart J, Jr, Pearlson GD. Neural correlates of the object-recall process in semantic memory. Psychiatry Res. 2006;147:115–126. - PubMed
    1. Barnes KA, Cohen AL, Power JD, Nelson SM, Dosenbach YB, Miezin FM, Petersen SE, Schlaggar BL. Identifying basal ganglia divisions in individuals using resting-state functional connectivity MRI. Front Syst Neurosci. 2010;4:18. - PMC - PubMed
    1. Berry KJ, Mielke PW., Jr A Monte Carlo investigation of the Fisher Z transformation for normal and nonnormal distributions. Psychol Rep. 2000;87:1101–1114. - PubMed

Publication types