Meta-Analysis
. 2011 Jun;43(6):531-8.
doi: 10.1038/ng.834. Epub 2011 May 15.

Meta-analysis of genome-wide association studies identifies common variants associated with blood pressure variation in east Asians

Affiliations
Meta-Analysis

Meta-analysis of genome-wide association studies identifies common variants associated with blood pressure variation in east Asians

Norihiro Kato et al. Nat Genet. 2011 Jun.

Abstract

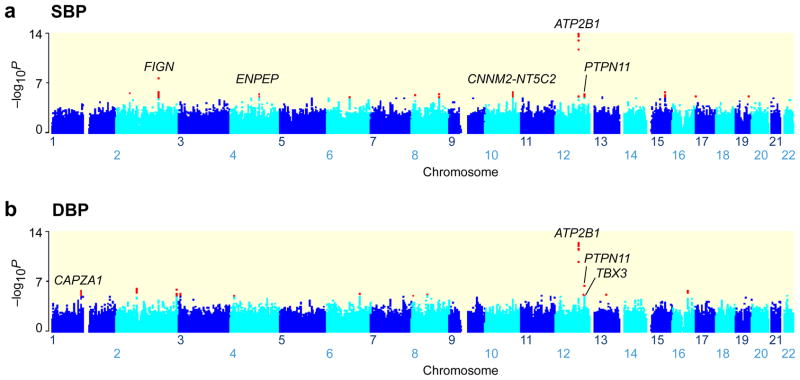
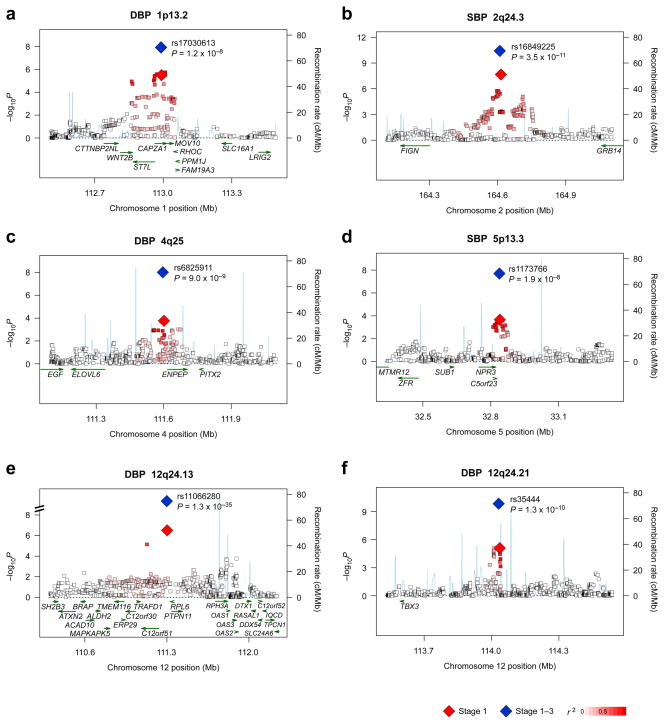
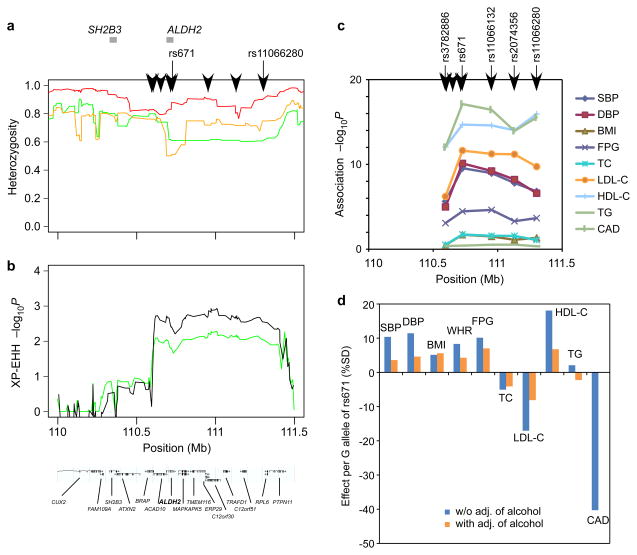
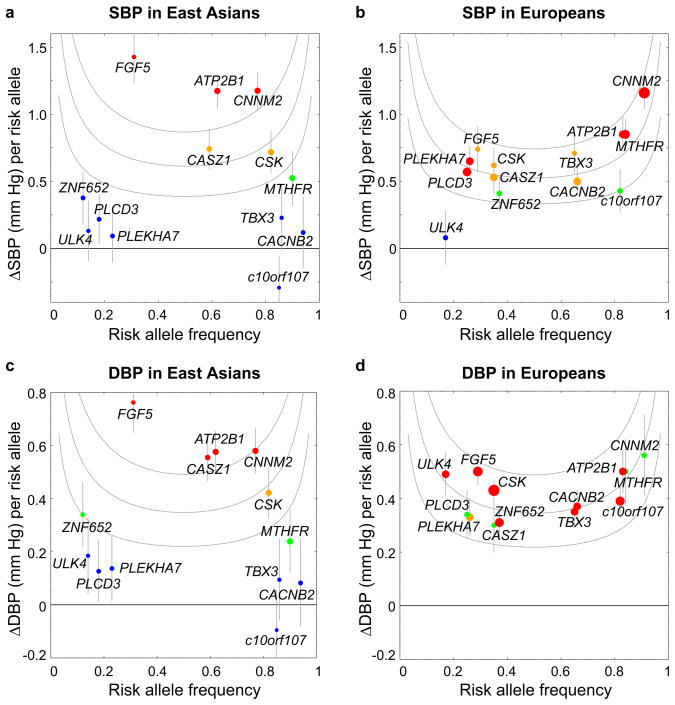
We conducted a meta-analysis of genome-wide association studies of systolic (SBP) and diastolic (DBP) blood pressure in 19,608 subjects of east Asian ancestry from the AGEN-BP consortium followed up with de novo genotyping (n = 10,518) and further replication (n = 20,247) in east Asian samples. We identified genome-wide significant (P < 5 × 10(-8)) associations with SBP or DBP, which included variants at four new loci (ST7L-CAPZA1, FIGN-GRB14, ENPEP and NPR3) and a newly discovered variant near TBX3. Among the five newly discovered variants, we obtained significant replication in the independent samples for all of these loci except NPR3. We also confirmed seven loci previously identified in populations of European descent. Moreover, at 12q24.13 near ALDH2, we observed strong association signals (P = 7.9 × 10(-31) and P = 1.3 × 10(-35) for SBP and DBP, respectively) with ethnic specificity. These findings provide new insights into blood pressure regulation and potential targets for intervention.


Figures

Fig. 1
Fig. 1
Genome-wide association results for the AGEN-BP meta-analysis for blood pressure. Manhattan plots show the significance of association between all SNPs and SBP (a) and DBP (b) in the stage 1 meta-analysis, highlighting signals with suggestive levels of significance (P < 10−5) in red. Seven named loci showed genome-wide significance (P < 5 × 10⁻⁸) in the joint analysis (stage 1 + 2 + 3; 2 reported loci—CNNM2-NT5C2 and ATP2B1—were followed up in part of stage 2 and stage 3). The genes used to name signals have been chosen on the basis of proximity to the lead SNP and should not be presumed to indicate causality.
Fig. 2
Fig. 2
Regional association plots of six blood pressure loci. Genotyped and imputed SNPs passing quality control measures in stage 1 are plotted with their meta-analysis P values (as −log10 values) as a function of genomic position (build 36). In each panel, the lead SNP is represented by a diamond, with stage 1 meta-analysis results denoted by a red diamond and the joint analysis (combined P) results denoted by a blue diamond. The correlation of the lead SNP to other SNPs at the locus is shown on a scale from minimal (white) to maximal (red). Superimposed on the plot are gene locations (green) and recombination rates (blue). The regional plots were drawn using the SNAP software. On 12q24.13, rs671 was not included in the construction of regional association plots (Fig. 2e) because the genotype data for this SNP were unavailable from two GWAS in stage 1, KARE and Suita (1), which resulted in an effective sample size of 9,828.
Fig. 3
Fig. 3
Evidence for positive selection and pleiotropic effects on 12q24.23. a. Lines show heterozygosity calculated in a sliding window of 20 SNPs in the East Asian (green), European (orange), and African (red) populations of the Human Genome Diversity Panel. Heterozygosity in East Asians dropped to 0.61 in a range from 110.7 to 111.4 Mb. Black arrowheads at the top of the plot represent the positions of SNPs forming an East Asian-specific haplotype with ALDH2 rs671. The positions of the SH2B3 and ALDH2 genes are highlighted by gray bars at the top of the plot. Signals of selection detected using a haplotype-based test, XP-EHH (b), in the East Asian population. Since there are multiple SNP clusters showing high LD within a cluster but relatively modest LD between clusters and no ancestral haplotype in East Asians (Supplementary Fig. 4), XP-EHH is assumed to provide more appropriate signals of selection than iHS on 12q24.23. Vertical axes represent empirical P values, where a suggestive level for positive selection is set at P < 0.01; i.e., −log10(P) >2. The results are shown for all East Asians combined (green line) and for Japanese (black line). c. The −log10(P) for associations with cardio-metabolic traits at 5 of the 8 SNPs forming a common East Asian-specific haplotype. The position of each SNP is denoted at the top of the plot. d. Per-allele effects of rs671 (G vs. A) on cardio-metabolic traits with and without adjustment for alcohol intake.
Fig. 4
Fig. 4
Plots of effect size (β) versus risk-allele frequency of 13 loci previously identified in European GWAS meta-analysis. The list of 13 loci includes 1 locus (CASZ1) that did not reach genome-wide significance in Europeans but is found to show a significant association with BP in the present AGEN-BP meta-analysis. Plots for SBP [East Asians(a); Europeans(b)] and DBP [East Asians(c); Europeans(d)] are depicted separately. Each point refers to a single BP association signal, with colors denoting the strength of the BP association (red, P < 5 × 10⁻⁸; orange, 5 × 10⁻⁸P < 10−5; green, 10−5P < 0.05; blue, P ≥ 0.05) and with sizes being proportional to the tested sample size. Whiskers are ± standard errors. The gene names associated with each signal have been chosen on the basis of proximity to the lead SNP and should not be presumed to indicate causality. The gray curves represent the coefficient of determination (R2), i.e., BP variance explained by an SNP (%); those from the top to the bottom correspond to R2 = 0.1, 0.05, and 0.02. For estimating R2, the standard deviations of BP were assumed to be 19.4 mm Hg (SBP) and 11.0 mm Hg (DBP) in East Asians, and 16.6 mm Hg (SBP) and 10.9 mm Hg (DBP) in Europeans. The risk alleles were designated as previously reported in European GWAS meta-analysis. See the details in Supplementary Table 5.

References

    1. Ezzati M, et al. Selected major risk factors and global and regional burden of disease. Lancet. 2002;360:1347–1360. - PubMed
    1. Lopez AD, et al. Global and regional burden of disease and risk factors, 2001: systematic analysis of population health data. Lancet. 2006;367:1747–1757. - PubMed
    1. Lawes CMM, Vander Hoorn S, Rodgers A. International Society of Hypertension. Global burden of blood-pressure-related disease, 2001. Lancet. 2008;371:1513–1518. - PubMed
    1. Kearney PM, et al. Global burden of hypertension: analysis of worldwide data. Lancet. 2005;365:217–223. - PubMed
    1. He J, et al. Premature deaths attributable to blood pressure in China: a prospective cohort study. Lancet. 2009;374:1765–1772. - PubMed

Publication types