. 2011 May 10;6(5):e19766.
doi: 10.1371/journal.pone.0019766.

Hydrogen sulfide attenuated tumor necrosis factor-α-induced inflammatory signaling and dysfunction in vascular endothelial cells

Affiliations

Hydrogen sulfide attenuated tumor necrosis factor-α-induced inflammatory signaling and dysfunction in vascular endothelial cells

Li-Long Pan et al. PLoS One. .

Retraction in

Abstract

Background: Hydrogen sulfide (H(2)S), the third physiologically relevant gaseous molecule, is recognized increasingly as an anti-inflammatory mediator in various inflammatory conditions. Herein, we explored the effects and mechanisms of sodium hydrosulfide (NaHS, a H(2)S donor) on tumor necrosis factor (TNF)-α-induced human umbilical vein endothelial cells (HUVEC) dysfunction.

Methodology and principal findings: Application of NaHS concentration-dependently suppressed TNF-α-induced mRNA and proteins expressions of intercellular adhesion molecule-1 (ICAM-1) and vascular cell adhesion molecule-1 (VCAM-1), mRNA expression of P-selectin and E-selectin as well as U937 monocytes adhesion to HUVEC. Western blot analysis revealed that the expression of the cytoprotective enzyme, heme oxygenase-1 (HO-1), was induced and coincident with the anti-inflammatory action of NaHS. Furthermore, TNF-α-induced NF-κB activation assessed by IκBα degradation and p65 phosphorylation and nuclear translocation and ROS production were diminished in cells subjected to treatment with NaHS.

Significance: H(2)S can exert an anti-inflammatory effect in endothelial cells through a mechanism that involves the up-regulation of HO-1.


Conflict of interest statement

Competing Interests: The authors have declared that no competing interests exist.

Figures

Figure 1
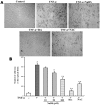
Figure 1. NaHS inhibited U937 cells adhesion to TNF-α-activated HUVEC.
HUVEC were incubated with indicated concentrations of NaHS, Dex (10 µM) or NAC (5 mM) for 30 min, then stimulated with TNF-α (10 ng/ml) for 6 h, U937 cells seed onto HUVEC and co-cultured for 2 h. After removing the non-adherent cells, adherent cells were detected and counted under a light microscope. (A) Pictures are representative optical fields. NaHS, Dex, and NAC concentrations were 100 µM, 10 µM, and 5 mM, respectively. (B) Quantitative analysis of the binding of U937 cells to HUVEC presented by bar graphs was counted under a light microscope. # P<0.05 compared with unstimulated cells, *P<0.05, **P<0.01 compared with TNF-α-stimulated control. Data are the mean ± S.E.M of results from at least three independent experiments, each performed in duplicate.
Figure 2
Figure 2. NaHS inhibited TNF-α-induced mRNA levels of adhesion molecules.
HUVEC were incubated with indicated concentrations of NaHS or Dex (10 µM) for 30 min, then stimulated with TNF-α (10 ng/ml) for 4 h. mRNA levels of adhesion molecules were analyzed by real-time RT-PCR. GAPDH was used as an internal control. Bar graphs in (A), (B), (C), (D) represented the quantitative difference in mRNA levels of E-selectin, P-selectin, ICAM-1, VCAM-1, respectively, between groups. Dex concentration was 10 µM. # P<0.05 compared with unstimulated cells, *P<0.05, **P<0.01 compared with TNF-α-stimulated cells. Data are the mean ± S.E.M of results from at least three independent experiments, each performed in duplicate.
Figure 3
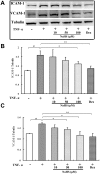
Figure 3. NaHS inhibited TNF-α-induced expression of ICAM-1 and VCAM-1.
HUVEC were pre-treated with NaHS (50–100 µM) or Dex (10 µM) for 30 min and then stimulated with TNF-α (10 ng/ml) for 6 h. (A) Representative Western blot showed the expression of ICAM-1 and VCAM-1. Tubulin was used as loading control. Bar graphs represent the quantitative difference in expression of ICAM-1 (B) and VCAM-1 (C), respectively, in arbitrary units. # P<0.05 compared with unstimulated cells, *P<0.05, **P<0.01 compared with TNF-α-stimulated cells. Data are the mean ± S.E.M of results from at least three independent experiments, each performed in duplicate.
Figure 4
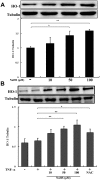
Figure 4. NaHS upregulated expression of HO-1 in HUVEC.
(A) HUVEC were incubated with indicated concentrations of NaHS for 6 hours. Cells were then lysed, and HO-1 expression was analyzed by Western blot. Tubulin was used as loading control. Data represent mean ±S.E.M from 3 independent repeats. *P<0.05, **P<0.01 compared with unstimulated cells. (B) HUVEC were incubated with various concentrations of NaHS for 30 min, cells were then stimulated with TNF-α (10 ng/ml) for 6 h. HO-1 proteins were analyzed by Western blot in HUVEC. Tubulin was used as loading control. NAC concentration was 5 mM. # P<0.05 compared with unstimulated cells, * P<0.05, ** P<0.01 compared with TNF-α-stimulated cells. Data are the mean ±S.E.M of results from at least three independent experiments, each performed in duplicate.
Figure 5
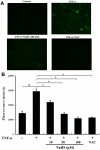
Figure 5. NaHS inhibited TNF-α-induced intracellular ROS generation.
HUVEC were incubated with NaHS or NAC for 30 min, and then stimulated with TNF-α (10 ng/ml) for 1 h. (A) Pictures are representative fields detected by fluorescence microscope. NaHS and NAC concentration were 100 µM and 5 mM, respectively. (B) Quantitation of intracellular ROS was determined by fluorescence spectrophotometer. NAC concentration was 5 mM. # P<0.05 compared with unstimulated cells, *P<0.05, **P<0.01 compared with TNF-α-stimulated cells. Data are the mean ±S.E.M of results from at least three independent experiments, each performed in duplicate.
Figure 6
Figure 6. NaHS inhibited TNF-α-induced p38 phosphorylation.
(A) HUVEC were stimulated with TNF-α (10 ng/ml) for indicated periods. The total and phosphorylation levels of MAPK were measured by Western blot. The experiment was repeated 3 times with equal results. Cells were incubated with indicated concentrations of NaHS for 30 min, then treated with TNF-α (10 ng/ml) for another 15 min. Phosphorylation levels of p38 (B), JNK1/2(C) and ERK1/2 (D) were analyzed by Western blot. # P<0.05 compared with unstimulated cells, *P<0.05 compared with TNF-α-stimulated cells. Data are the mean ± S.E.M of results from at least three independent experiments, each performed in duplicate.
Figure 7
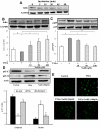
Figure 7. NaHS inhibited TNF-α-induced IκBα degradation and NF-κB activation.
(A) IκBα degradation was analyzed by Western blot in HUVEC stimulated with TNF-α (10 ng/ml) for indicated periods. (B) HUVEC were incubated with indicated concentrations of NaHS for 30 min, then stimulated with TNF-α (10 ng/ml) for another 15 min. IκBα degradation was analyzed by Western blot. (C) HUVEC were incubated with indicated concentrations of NaHS for 30 min, then stimulated with TNF-α (10 ng/ml) for another 15 min. Phosphorylation levels of NF-κB p65 was analyzed by Western blot. (D) HUVEC were incubated with NaHS (100 µM) for 30 min, then stimulated with TNF-α (10 ng/ml) for another 1 h. Cytoplasmic and nuclear levels of NF-κB p65 were analyzed by Western blot. # P<0.05 compared with unstimulated cells, *P<0.05, **P<0.01 compared with TNF-α-stimulated cells. Data are the mean ± S.E.M of results from at least three independent experiments, each performed in duplicate. (E) HUVEC were incubated with NaHS (50, 100 µM) for 30 min, then stimulated with TNF-α (10 ng/ml) for another 1 h. NF-κB p65 translocation was detected by fluorescent microscope.

References

    1. Ross R. Atherosclerosis-an inflammatory disease. N Engl J Med. 1999;340:115–126. - PubMed
    1. Libby P. Inflammation in atherosclerosis. Nature. 2002;420:868–874. - PubMed
    1. Borel JC, Roux-Lombard P, Tamisier R, Arnaud C, Monneret D, et al. Endothelial dysfunction and specific inflammation in obesity hypoventilation syndrome. PLoS One. 2009;4:e6733. - PMC - PubMed
    1. Szmitko PE, Wang CH, Weisel RD, Jeffries GA, Anderson TJ, et al. Biomarkers of vascular disease linking inflammation to endothelial activation: Part II. Circulation. 2003;108:2041–8. - PubMed
    1. Sprague AH, Khalil RA. Inflammatory cytokines in vascular dysfunction and vascular disease. Biochem Pharmacol. 2009;78:539–552. - PMC - PubMed

Publication types

MeSH terms