. 2011 May 10;5(5):e1021.
doi: 10.1371/journal.pntd.0001021.

Comparative gene expression analysis throughout the life cycle of Leishmania braziliensis: diversity of expression profiles among clinical isolates

Affiliations

Comparative gene expression analysis throughout the life cycle of Leishmania braziliensis: diversity of expression profiles among clinical isolates

Vanessa Adaui et al. PLoS Negl Trop Dis. .

Abstract

Background: Most of the Leishmania genome is reported to be constitutively expressed during the life cycle of the parasite, with a few regulated genes. Inter-species comparative transcriptomics evidenced a low number of species-specific differences related to differentially distributed genes or the differential regulation of conserved genes. It is of uppermost importance to ensure that the observed differences are indeed species-specific and not simply specific of the strains selected for representing the species. The relevance of this concern is illustrated by current study.

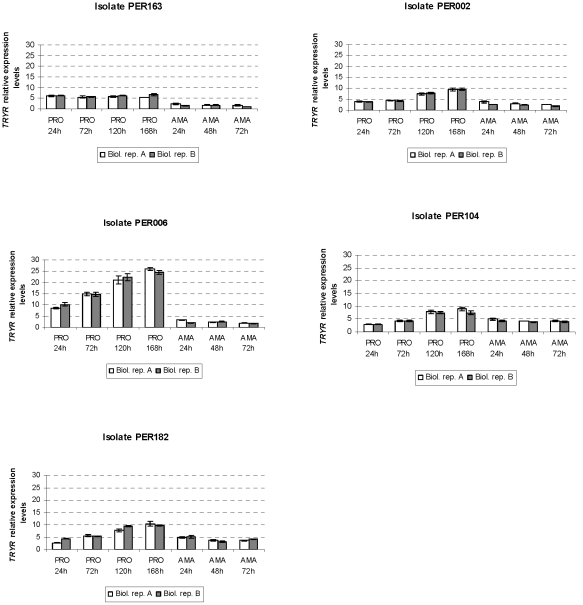
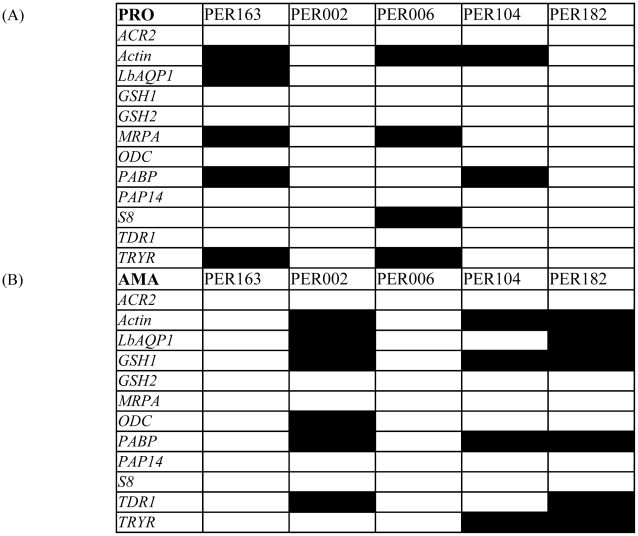
Methodology/principal findings: We selected 5 clinical isolates of L. braziliensis characterized by their diversity of clinical and in vitro phenotypes. Real-time quantitative PCR was performed on promastigote and amastigote life stages to assess gene expression profiles at seven time points covering the whole life cycle. We tested 12 genes encoding proteins with roles in transport, thiol-based redox metabolism, cellular reduction, RNA poly(A)-tail metabolism, cytoskeleton function and ribosomal function. The general trend of expression profiles showed that regulation of gene expression essentially occurs around the stationary phase of promastigotes. However, the genes involved in this phenomenon appeared to vary significantly among the isolates considered.

Conclusion/significance: Our results clearly illustrate the unique character of each isolate in terms of gene expression dynamics. Results obtained on an individual strain are not necessarily representative of a given species. Therefore, extreme care should be taken when comparing the profiles of different species and extrapolating functional differences between them.


Conflict of interest statement

The authors have declared that no competing interests exist.

Figures

Figure 1
Figure 1. Neighbor-Joining dendrogram based on p-distances of the hsp70 sequences determined in this study, aligned with those from Fraga et al. as a reference set.
The total alignment contains 1380 nucleotides. Bootstrap support of the branches was inferred from 2000 replicates, and is shown in percentages at the internodes when exceeding 70%. The tree is drawn according to the scale on the left, expressed as distance per nucleotide. Different species are depicted on the right, whereby species of the L. (Leishmania) subgenus are condensed. The tree was rooted on the branch leading to L. (Viannia). Isolates are indicated with their WHO code wherever possible, with accession numbers between brackets. Accessions starting with XM are derived from a contemporary annotation of full genome sequences, and are GenBank specific.
Figure 2
Figure 2. Variation in LbAQP1 gene expression throughout in vitro growth and differentiation of promastigotes and intracellular amastigotes of L. braziliensis isolates studied.
Time scale in promastigotes (PRO): 24 h, 72 h, 120 h and 168 h of growth. Time scale in intracellular amastigotes (AMA): 24 h, 48 h, and 72 h post-infection macrophages. White and grey bars at each time point represent two experimental biological replicate series (A and B). Normalized expression levels of each gene were rescaled relative to the sample with the lowest expression. Results are expressed as means (± standard errors) of triplicate measurements from one quantitative experiment.
Figure 3
Figure 3. Variation in TRYR gene expression throughout in vitro growth and differentiation of promastigotes and intracellular amastigotes of L. braziliensis isolates studied (see legend of figure 2 ).
Figure 4
Figure 4. Variation in Actin gene expression throughout in vitro growth and differentiation of promastigotes and intracellular amastigotes of L. braziliensis isolates studied (see legend of figure 2 ).
Figure 5
Figure 5. Comparison of baseline expression levels among studied isolates.
(A) Gene expression analysis among promastigotes: PRO constant term, measure of the baseline expression of a given gene in the promastigote stage (highlighted in black if significantly higher –by at least 2-fold– than the lowest constant term in the series). (B) Gene expression analysis among amastigotes: AMA constant term, measure of the baseline expression of a given gene in the amastigote stage (highlighted in black if significantly different –by at least 2-fold– from the lowest constant term in the series).
Figure 6
Figure 6. Gene expression modulation in different development stages of studied isolates.
Modulation of gene expression can be in the form of increased expression (up-regulation) or decreased expression (down-regulation); a 2-fold cutoff was used here. (A) FC-PRO, measure of gene expression modulation during development of promastigotes (highlighted in black if up-regulation –i.e. at least 2-fold increase– is present). (B) FC-PRO-AMA, measure of gene expression modulation during transition from promastigotes to amastigotes (highlighted in black if modulation, always down-regulation –i.e. at least 2-fold decrease–, is present). (C) FC-AMA, measure of gene expression modulation during development of amastigotes (highlighted in black if modulation is present).

References

    1. Barak E, Amin-Spector S, Gerliak E, Goyard S, Holland N, et al. Differentiation of Leishmania donovani in host-free system: analysis of signal perception and response. Mol Biochem Parasitol. 2005;141:99–108. - PubMed
    1. Haile S, Papadopoulou B. Developmental regulation of gene expression in trypanosomatid parasitic protozoa. Curr Opin Microbiol. 2007;10:569–577. - PubMed
    1. Saxena A, Lahav T, Holland N, Aggarwal G, Anupama A, et al. Analysis of the Leishmania donovani transcriptome reveals an ordered progression of transient and permanent changes in gene expression during differentiation. Mol Biochem Parasitol. 2007;152:53–65. - PMC - PubMed
    1. Alcolea PJ, Alonso A, Gómez MJ, Moreno I, Domínguez M, et al. Transcriptomics throughout the life cycle of Leishmania infantum: high down-regulation rate in the amastigote stage. Int J Parasitol. 2010;40:1497–1516. - PubMed
    1. Depledge DP, Evans KJ, Ivens AC, Aziz N, Maroof A, et al. Comparative expression profiling of Leishmania: modulation in gene expression between species and in different host genetic backgrounds. PLoS Negl Trop Dis. 2009;3:e476. - PMC - PubMed

Publication types

MeSH terms

Associated data