

The infection of chicken tracheal epithelial cells with a H6N1 avian influenza virus
- PMID: 21573102
- PMCID: PMC3089607
- DOI: 10.1371/journal.pone.0018894
The infection of chicken tracheal epithelial cells with a H6N1 avian influenza virus
Abstract
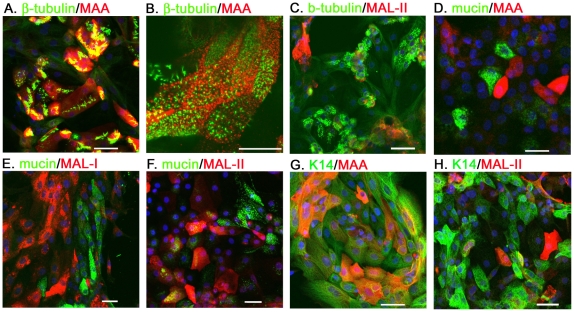
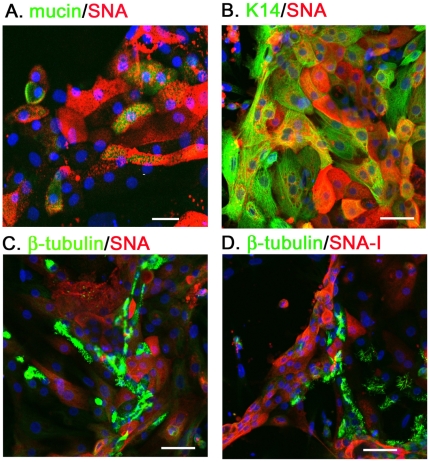
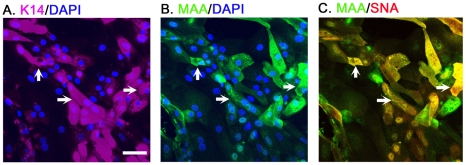
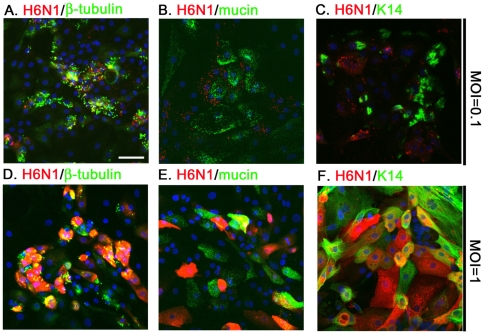
Sialic acids (SAs) linked to galactose (Gal) in α2,3- and α2,6-configurations are the receptors for avian and human influenza viruses, respectively. We demonstrate that chicken tracheal ciliated cells express α2,3-linked SA, while goblet cells mainly express α2,6-linked SA. In addition, the plant lectin MAL-II, but not MAA/MAL-I, is bound to the surface of goblet cells, suggesting that SA2,3-linked oligosaccharides with Galβ1-3GalNAc subterminal residues are specifically present on the goblet cells. Moreover, both α2,3- and α2,6-linked SAs are detected on single tracheal basal cells. At a low multiplicity of infection (MOI) avian influenza virus H6N1 is exclusively detected in the ciliated cells, suggesting that the ciliated cell is the major target cell of the H6N1 virus. At a MOI of 1, ciliated, goblet and basal cells are all permissive to the AIV infection. This result clearly elucidates the receptor distribution for the avian influenza virus among chicken tracheal epithelial cells and illustrates a primary cell model for evaluating the cell tropisms of respiratory viruses in poultry.
Conflict of interest statement
Figures
Similar articles
-
Human trachea primary epithelial cells express both sialyl(alpha2-3)Gal receptor for human parainfluenza virus type 1 and avian influenza viruses, and sialyl(alpha2-6)Gal receptor for human influenza viruses.Glycoconj J. 2006 Feb;23(1-2):101-6. doi: 10.1007/s10719-006-5442-z. Glycoconj J. 2006. PMID: 16575527
-
Tropism and infectivity of influenza virus, including highly pathogenic avian H5N1 virus, in ferret tracheal differentiated primary epithelial cell cultures.J Virol. 2013 Mar;87(5):2597-607. doi: 10.1128/JVI.02885-12. Epub 2012 Dec 19. J Virol. 2013. PMID: 23255802 Free PMC article.
-
Tropism and Infectivity of a Seasonal A(H1N1) and a Highly Pathogenic Avian A(H5N1) Influenza Virus in Primary Differentiated Ferret Nasal Epithelial Cell Cultures.J Virol. 2019 May 1;93(10):e00080-19. doi: 10.1128/JVI.00080-19. Print 2019 May 15. J Virol. 2019. PMID: 30814288 Free PMC article.
-
Influenza virus receptor specificity and cell tropism in mouse and human airway epithelial cells.J Virol. 2006 Aug;80(15):7469-80. doi: 10.1128/JVI.02677-05. J Virol. 2006. PMID: 16840327 Free PMC article.
-
Avian influenza.Chang Gung Med J. 2005 Nov;28(11):753-7. Chang Gung Med J. 2005. PMID: 16422180 Review.
Cited by
-
Antiviral responses against chicken respiratory infections: Focus on avian influenza virus and infectious bronchitis virus.Cytokine. 2020 Mar;127:154961. doi: 10.1016/j.cyto.2019.154961. Epub 2019 Dec 31. Cytokine. 2020. PMID: 31901597 Free PMC article. Review.
-
Inhibition of H9N2 Virus Invasion into Dendritic Cells by the S-Layer Protein from L. acidophilus ATCC 4356.Front Cell Infect Microbiol. 2016 Oct 25;6:137. doi: 10.3389/fcimb.2016.00137. eCollection 2016. Front Cell Infect Microbiol. 2016. PMID: 27826541 Free PMC article.
-
Mutation tryptophan to leucine at position 222 of haemagglutinin could facilitate H3N2 influenza A virus infection in dogs.J Gen Virol. 2013 Dec;94(Pt 12):2599-2608. doi: 10.1099/vir.0.054692-0. Epub 2013 Sep 1. J Gen Virol. 2013. PMID: 23994833 Free PMC article.
-
Effect of enrofloxacin on clinical parameters and mucociliary system of broilers challenged with H9N2 avian influenza/infectious bronchitis viruses.Vet Med Sci. 2024 Mar;10(2):e1390. doi: 10.1002/vms3.1390. Vet Med Sci. 2024. PMID: 38419286 Free PMC article.
-
Impact of chicken-origin cells on adaptation of a low pathogenic influenza virus.Cytotechnology. 2013 May;65(3):419-24. doi: 10.1007/s10616-012-9495-5. Epub 2012 Sep 26. Cytotechnology. 2013. PMID: 23011740 Free PMC article.
References
-
- Buschiazzo A, Alzari PM. Structural insights into sialic acid enzymology. Curr Opin Chem Biol. 2008;12:565–572. - PubMed
-
- Schauer R, Srinivasan GV, Coddeville B, Zanetta JP, Guerardel Y. Low incidence of N-glycolylneuraminic acid in birds and reptiles and its absence in the platypus. Carbohydr Res. 2009;344:1494–1500. - PubMed
-
- Nicholls JM, Chan RW, Russell RJ, Air GM, Peiris JS. Evolving complexities of influenza virus and its receptors. Trends Microbiol. 2008;16:149–157. - PubMed
-
- Functional glycomics research website (2005). Available: http://www.functionalglycomics.org/static/index.shtml. Accessed 2011 Jan 6.
Publication types
MeSH terms
LinkOut - more resources
Full Text Sources
Other Literature Sources
Research Materials
