. 2011 May 6;6(5):e18940.
doi: 10.1371/journal.pone.0018940.

Multizone paper platform for 3D cell cultures

Affiliations

Multizone paper platform for 3D cell cultures

Ratmir Derda et al. PLoS One. .

Abstract

In vitro 3D culture is an important model for tissues in vivo. Cells in different locations of 3D tissues are physiologically different, because they are exposed to different concentrations of oxygen, nutrients, and signaling molecules, and to other environmental factors (temperature, mechanical stress, etc). The majority of high-throughput assays based on 3D cultures, however, can only detect the average behavior of cells in the whole 3D construct. Isolation of cells from specific regions of 3D cultures is possible, but relies on low-throughput techniques such as tissue sectioning and micromanipulation. Based on a procedure reported previously ("cells-in-gels-in-paper" or CiGiP), this paper describes a simple method for culture of arrays of thin planar sections of tissues, either alone or stacked to create more complex 3D tissue structures. This procedure starts with sheets of paper patterned with hydrophobic regions that form 96 hydrophilic zones. Serial spotting of cells suspended in extracellular matrix (ECM) gel onto the patterned paper creates an array of 200 micron-thick slabs of ECM gel (supported mechanically by cellulose fibers) containing cells. Stacking the sheets with zones aligned on top of one another assembles 96 3D multilayer constructs. De-stacking the layers of the 3D culture, by peeling apart the sheets of paper, "sections" all 96 cultures at once. It is, thus, simple to isolate 200-micron-thick cell-containing slabs from each 3D culture in the 96-zone array. Because the 3D cultures are assembled from multiple layers, the number of cells plated initially in each layer determines the spatial distribution of cells in the stacked 3D cultures. This capability made it possible to compare the growth of 3D tumor models of different spatial composition, and to examine the migration of cells in these structures.


Conflict of interest statement

Competing Interests: GM Whitesides has received a research grant from Vertex Inc. This grant does not influence his adherence to all PLoS ONE policies on sharing data and materials.

Figures

Figure 1
Figure 1. Generation and analysis of multi-zone cultures.
(A) Multi-zone plates are printed using commercially-available printer equipped with a solid-ink cartridge. Heating the paper causes the ink on the surface of paper to diffuse into the paper, and to form hydrophobic barriers that separate 96 hydrophilic zones. (B) Cells are seeded into the hydrophilic zones using a parallel or repeater pipette. (C) Stacking 96-zone paper plates assembles 96 3D cell cultures; a metal holder holds compresses them into contact. The 3D cultures are maintained submerged in a common culture medium. (D) We imaged the layers using a fluorescent gel scanner. Image of the 96-zones plate that contained eight concentrations of cells. Black color is proportional to the fluorescence of GFP measured by a gel scanner. (E) Image analysis software mapped the location of each zone, measured average value for grey scale intensity inside each zone (inside black circle), and subtracted the average grey scale intensity outsize the zones (along the dotted circumference). (F) Graph showing correlation between average grey scale intensity and the number of cells for each zone in (D). The fitted curve was used as a calibration curve, which converts intensity of GFP to the number of cells.
Figure 2
Figure 2. Scheme of the multi-zone, muli-layer sample containing high (H) and low (L) concentrations of cells in specific locations (red, H: 120,000 cells/zone or pink, L: 12,000 cells/zone).
(A) Layers prior to stacking. Only three out of eight replicates are shown; to simplify visualizations. (B) Stacking the layers L1 through L8 generates L1L8-stack. (C) Distribution of GFP-MDA-MB-231 cells in layers L1 through L8. Dark grey color denotes zones that contain 120,000 cell/zone (“H”); light grey color denotes those that contain 12,000 cells/zone (“L”). Experiments are separated by vertical black lines.
Figure 3
Figure 3. Distribution of cells in multi-zone multi-layer samples described in Fig. 2 before and after nine days of culture.
(A) Average concentrations of cells per zone were calculated from average intensity of the GFP in the zone using curve described in Fig. 1F. The grey outlined area depicts the initial number of cells in each sample. (B) We assembled the cultures identical to those described in Fig. 2C using GFP-MDA-MB-231 cells arrested with MMC. The graph represents the average number of cells after nine days of culture. The graphs present data from eight replicates; the width of the overlaying bar is 2x (standard deviation). In the locations marked by red arrows, the number of cells in the presence of MMC was significantly lower (p<0.05) than that in the absence of MMC.
Figure 4
Figure 4. Scheme and the results of the migration experiment.
(A) 3D culture composed of the layers that contain MDA-MB-231-GFP-cells in layers L2, L5, L8 and MDA-MB-231-mTomato cells in the other layers. (B) We created multi-layers culture identical to that described in Fig. 2 using GFP- and mTomato-labeled cells. Zones marked by green and red color depict location of Tomato and GFP cells respectively; intensity of color depicts concentration (C) Migration of GFP cells can be detected as increase in GFP fluorescence in layers L1, L3, L4, L5, L6. (D) After nine days of culture, we destacked the layers, quantified GFP fluorescence in each zone of each layer (experiment e1 is used as example). GFP cells are present in layers L1, L3, L4, L5, and L6 due to the migration from layers L2, L5, and L8. (D) Graph describing the percentage of GFP(+) cells that migrated. (F) Migration depended on the relative number of cells in “sender” and “receiver” layers. (G) For layers that contained similar number of cells, migration of cells was directional: significantly more cells migrated to the upper layer (towards oxygen) than to the lower layer. (H) Migration of cells to the upper layer depended on the location of the cells inside the stacks: cells in hypoxic layer L8 migrated significantly less that those in layers L1 and L5 with higher oxygen concentration.
Figure 5
Figure 5. Heat map representation of the radial distribution of the fluorescent intensity in each zone of the multi-zone plate.
(A) We defined polar coordinate system (r, ϕ) for each zone (r = 0 in the middle of the zone, ϕ = 0 on the axis dividing the zone in half). Integration of the image in ϕ  = (0; π) and ϕ  = (π; 2π) range for discrete r yielded left and right radial distribution of gray scale intensity. For a zone with a radius of 3.0 mm imaged with 100 um resolution, we measured 33 radial distributions for r = 1,2,...,33 pixels (the outer 10% of the distribution represent an intensity of background fluorescence). Both radial distributions can be presented in a 1×76 heat map. (B) We “stacked” radial distributions from zones in the same column that correspond to the replicates of the same experiment; here, eight replicates are visualized as 8×76 heat map. (C) A sheet that contains six experiments with eight replicates each can be presented as 8×456 heat map. In this example, we prepared two suspensions of MDA-MB-231-GFP cells in Matrigel (high, 3×10⁷ cells/mL and low concentration, 3×10⁶ cells/mL) and spotted 4 µL of these suspensions on zones of a 48-zone plate. The image was acquired using fluorescent scanner and the intensity of black color is proportional to GFP fluorescence; heat map, hence, also represents distribution of fluorescence of GFP in this sample.
Figure 6
Figure 6. Heat map representation of the radial distribution of intensities in multi-layer experiments.
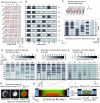
(A) Scheme of the multi-zone sample described in Fig. 2 (red: 120,000 cells/zone or pink: 12,000 cells/zone). Only three out of eight replicates are shown; to simplify visualizations. (B) Heat map representation of the radial distribution of GFP fluorescence of layers L1 through L8; experiments are separated by vertical black lines (see Fig. 5 for details of heat map). (C) Stacking the layers L1 through L8 generates L1L8-stack. Stacking eight heat maps generates a heat map which describes the whole L1L8-stack. Conveniently, coarse view of the map provides an estimate of fluorescent intensity at the cross-section of the L1L8 stack, whereas the fine structure of map provides an estimate of variation of intensities within each zone or variability between different zones. (D–F) Nine days after stacking and culture, we de-stacked the layers and quantified the distribution of GFP fluorescence (D), distribution of live cells that stain with calcein (E), and distribution of dead cells that stain with propidium iodide (PI) (F). (G) Images of stains in each zone demonstrate that lateral distributions of intensity of calcein and PI inside the zones are complimentary. Image in (H) is an overlay of rescaled heat maps from (E) and (F); the image demonstrates that viable cells reside in the shell of 6 mm in diameter and ∼800 micron in thickness. (I) Scheme describing possible path of diffusion of oxygen and nutrients through the stacks.
Figure 7
Figure 7. Controlling lateral distribution of cells in 3D stacks.
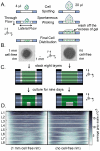
(A) Schematic describing the effect of spotting volume on final distribution of cells in a zone (B) Distribution of GFP intensity (proportional to black color) in zones spotted with 4 µl and 20 µl of suspension of MDA-MB-231-GFP cells in Matrigel. (C) We stacked eight sheets that contained cells in gels depicted in (B), and analyzed distribution of cells after nine days of culture. (D) Heat map representation of the radial distribution of GFP fluorescence of layer L1 through L8; experiments are separated by vertical black lines, layers are separated by white lines (see Fig. 5 for details of heat map).
Figure 8
Figure 8. Effect of diffusion barriers on cell distribution.
(A) Scheme depicting use of a cellulose acetate sheet with holes to control the diffusion of oxygen and nutrient to the cells in 3D gels from the bulk media. All layers (L1–L8) contained uniform concentrations of cells in all zones (40,000 cell/zone in Matrigel). (B) Representative images of the zone layers after nine days of culture; the samples were stained with calcein. (C) Scheme of the distribution of cells (green) in stacks and source for diffusion of oxygen/nutrient through the opening in the cellulose acetate layer atop of each stack (black) or through the wax-patterned paper (blue). (D) Heat map of the radial distribution of calcein stain in the stacks depicted in (C); the size of the holes are drawn to scale. (E–H) Experiments that provide a qualitative comparison of the diffusion rates of oxygen/nutrients through wax-printed (left side) and wax-free paper (right side). (F) Cells were spotted in the middle circle of the wax-printed pattern (E). We stacked eight layers depicted in (F), covered the cell containing zone with cellulose acetate and cultured the construct for nine days. (H) After de-stacking the layers, staining live cells with calcein and scanning the samples demonstrated that more cells resided next to the wax-patterned area than next to the wax-free area. (I) Scheme describing side view of the stack and heat map (J) describing radial distribution of calcein intensity in the stack. Images in (A–H) were acquired using fluorescent gel scanner (100 µm resolution), black color is proportional to the intensity of green fluorescence (calcein viability stain). See Fig. 5 for details of heat map in (D) and (J).

Similar articles

Cited by

References

    1. Abbott A. Cell culture: Biology's new dimension. Nature. 2003;424:870–872. - PubMed
    1. Sutherland RM. Cell and Environment Interactions in Tumor Microregions-the Multicell Spheroid Model. Science. 1988;240:177–184. - PubMed
    1. Yamada KM, Cukierman E. Modeling tissue morphogenesis and cancer in 3D. Cell. 2007;130:601–610. - PubMed
    1. Kenny PA, Lee GY, Myers CA, Neve RM, Semeiks JR, et al. The morphologies of breast cancer cell lines in three-dimensional assays correlate with their profiles of gene expression. Molecular Oncology. 2007;1:84–96. - PMC - PubMed
    1. Schmeichel KL, Bissell MJ. Modeling tissue-specific signaling and organ function in three dimensions. Journal of Cell Science. 2003;116:2377–2388. - PMC - PubMed

Publication types