

ALG: automated genotype calling of Luminex assays
- PMID: 21573116
- PMCID: PMC3089621
- DOI: 10.1371/journal.pone.0019368
ALG: automated genotype calling of Luminex assays
Abstract
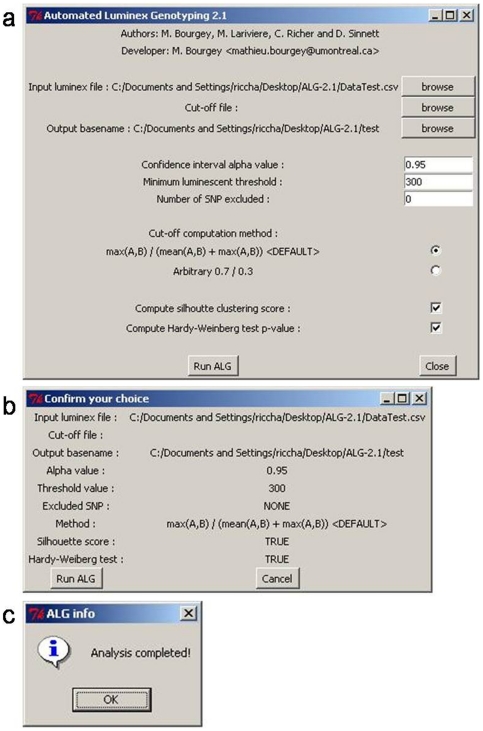
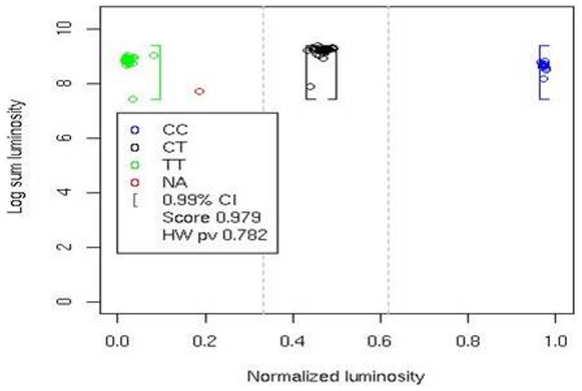
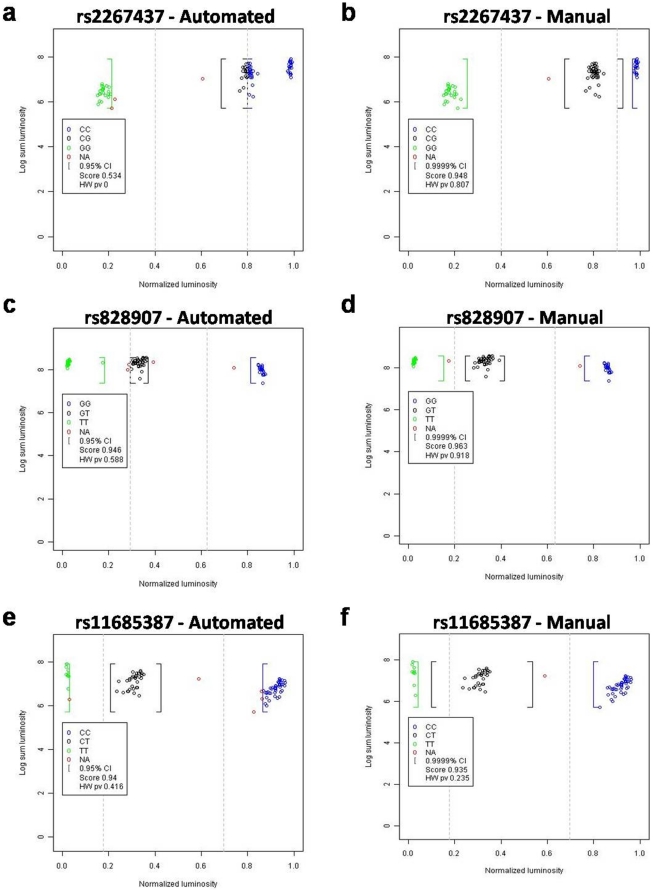
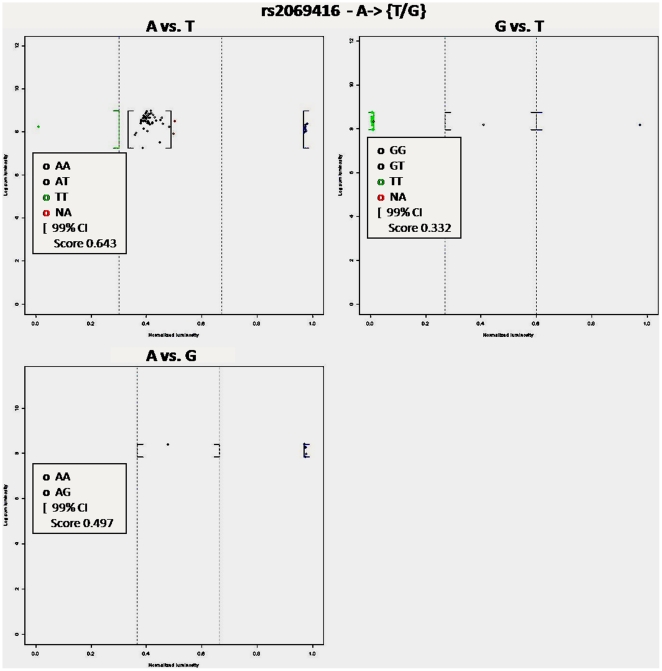
Single nucleotide polymorphisms (SNPs) are the most commonly used polymorphic markers in genetics studies. Among the different platforms for SNP genotyping, Luminex is one of the less exploited mainly due to the lack of a robust (semi-automated and replicable) freely available genotype calling software. Here we describe a clustering algorithm that provides automated SNP calls for Luminex genotyping assays. We genotyped 3 SNPs in a cohort of 330 childhood leukemia patients, 200 parents of patient and 325 healthy individuals and used the Automated Luminex Genotyping (ALG) algorithm for SNP calling. ALG genotypes were called twice to test for reproducibility and were compared to sequencing data to test for accuracy. Globally, this analysis demonstrates the accuracy (99.6%) of the method, its reproducibility (99.8%) and the low level of no genotyping calls (3.4%). The high efficiency of the method proves that ALG is a suitable alternative to the current commercial software. ALG is semi-automated, and provides numerical measures of confidence for each SNP called, as well as an effective graphical plot. Moreover ALG can be used either through a graphical user interface, requiring no specific informatics knowledge, or through command line with access to the open source code. The ALG software has been implemented in R and is freely available for non-commercial use either at http://alg.sourceforge.net or by request to mathieu.bourgey@umontreal.ca.
Conflict of interest statement
Figures
Similar articles
-
Automated SNP genotype clustering algorithm to improve data completeness in high-throughput SNP genotyping datasets from custom arrays.Genomics Proteomics Bioinformatics. 2007 Dec;5(3-4):256-9. doi: 10.1016/S1672-0229(08)60014-5. Genomics Proteomics Bioinformatics. 2007. PMID: 18267308 Free PMC article.
-
SNiPer: improved SNP genotype calling for Affymetrix 10K GeneChip microarray data.BMC Genomics. 2005 Oct 31;6:149. doi: 10.1186/1471-2164-6-149. BMC Genomics. 2005. PMID: 16262895 Free PMC article.
-
A multi-array multi-SNP genotyping algorithm for Affymetrix SNP microarrays.Bioinformatics. 2007 Jun 15;23(12):1459-67. doi: 10.1093/bioinformatics/btm131. Epub 2007 Apr 25. Bioinformatics. 2007. PMID: 17459966
-
A genotype calling algorithm for the Illumina BeadArray platform.Bioinformatics. 2007 Oct 15;23(20):2741-6. doi: 10.1093/bioinformatics/btm443. Epub 2007 Sep 10. Bioinformatics. 2007. PMID: 17846035 Free PMC article.
-
High-throughput methods for SNP genotyping.Methods Mol Biol. 2009;578:245-54. doi: 10.1007/978-1-60327-411-1_16. Methods Mol Biol. 2009. PMID: 19768599 Review.
Cited by
-
Multiplex Detection of SNPs for Genetic Monitoring in Laboratory Mice by Luminex xTAG Assay.Genes (Basel). 2024 Dec 19;15(12):1622. doi: 10.3390/genes15121622. Genes (Basel). 2024. PMID: 39766889 Free PMC article.
-
Detection of fetomaternal genotype associations in early-onset disorders: evaluation of different methods and their application to childhood leukemia.J Biomed Biotechnol. 2010;2010:369534. doi: 10.1155/2010/369534. Epub 2010 Jun 9. J Biomed Biotechnol. 2010. PMID: 20617153 Free PMC article.
-
Association between genetic variants in the HNF4A gene and childhood-onset Crohn's disease.Genes Immun. 2012 Oct;13(7):556-65. doi: 10.1038/gene.2012.37. Epub 2012 Aug 23. Genes Immun. 2012. PMID: 22914433 Free PMC article.
-
Hepatocyte nuclear factor 4 alpha polymorphisms and the metabolic syndrome in French-Canadian youth.PLoS One. 2015 Feb 11;10(2):e0117238. doi: 10.1371/journal.pone.0117238. eCollection 2015. PLoS One. 2015. PMID: 25671620 Free PMC article.
-
Optimizing multiplex SNP-based data analysis for genotyping of Mycobacterium tuberculosis isolates.BMC Genomics. 2014 Jul 7;15(1):572. doi: 10.1186/1471-2164-15-572. BMC Genomics. 2014. PMID: 25001491 Free PMC article.
References
-
- Weeks DE, Lathrop GM. Polygenic disease: methods for mapping complex disease traits. Trends Genet. 1995;11:513–519. - PubMed
-
- Clayton DG, Walker NM, Smyth DJ, Pask R, Cooper JD, et al. Population structure, differential bias and genomic control in a large-scale, case-control association study. Nat Genet. 2005;37:1243–1246. - PubMed
Publication types
MeSH terms
Grants and funding
LinkOut - more resources
Full Text Sources
