. 2011 May;7(5):e1001337.
doi: 10.1371/journal.ppat.1001337. Epub 2011 May 5.

Clonal structure of rapid-onset MDV-driven CD4+ lymphomas and responding CD8+ T cells

Affiliations

Clonal structure of rapid-onset MDV-driven CD4+ lymphomas and responding CD8+ T cells

William N Mwangi et al. PLoS Pathog. 2011 May.

Abstract

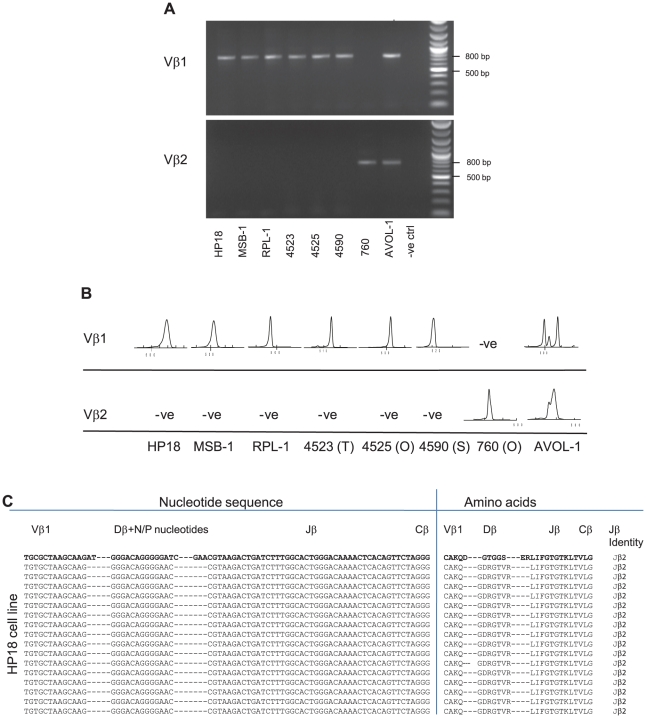
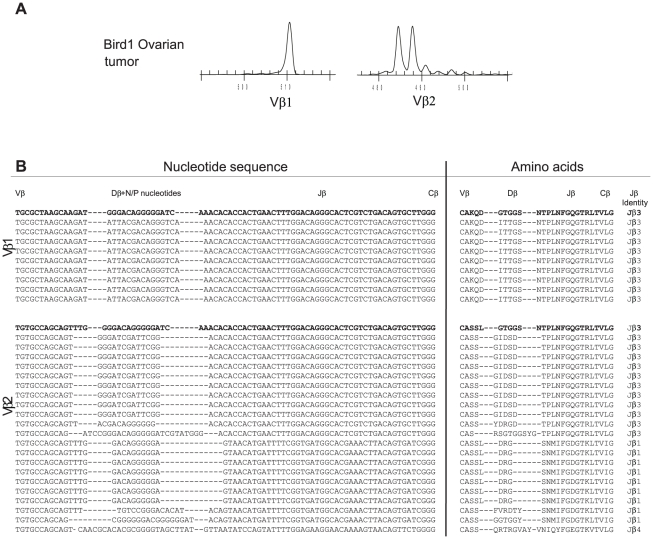
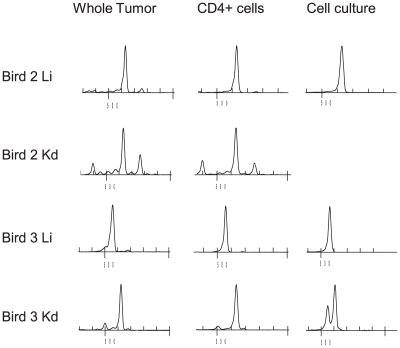
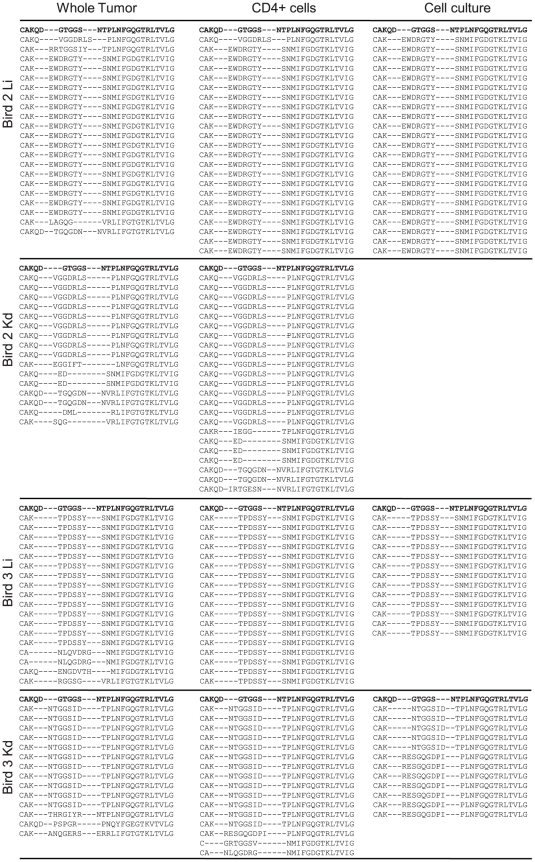
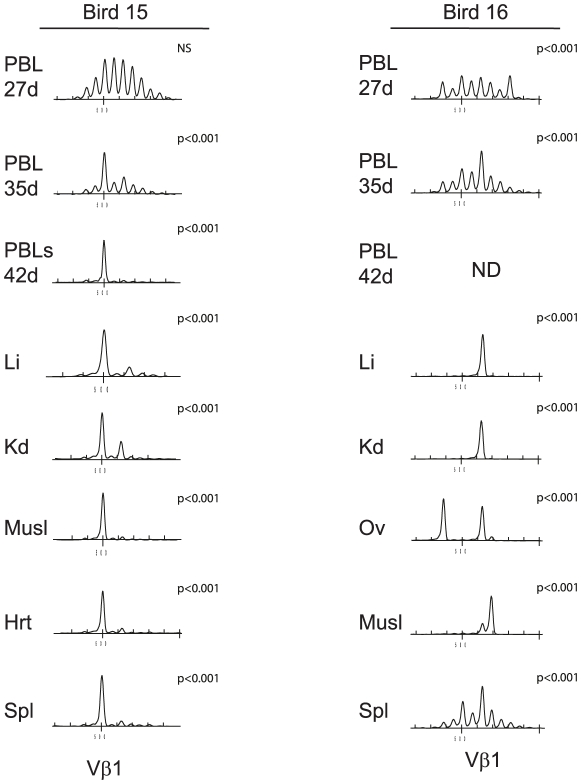
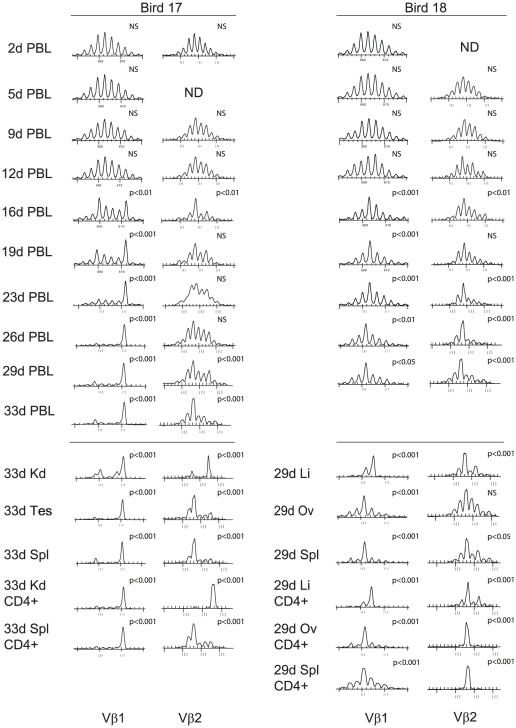
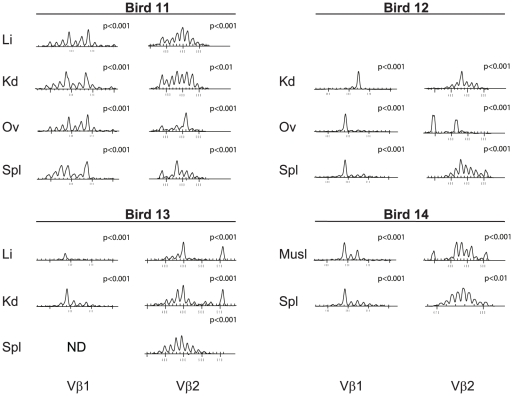
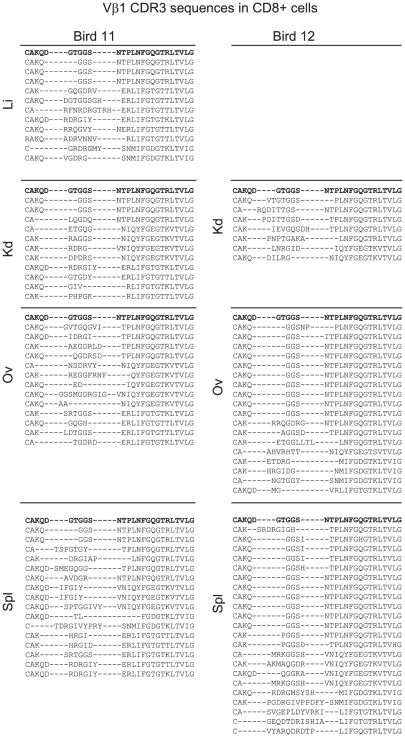
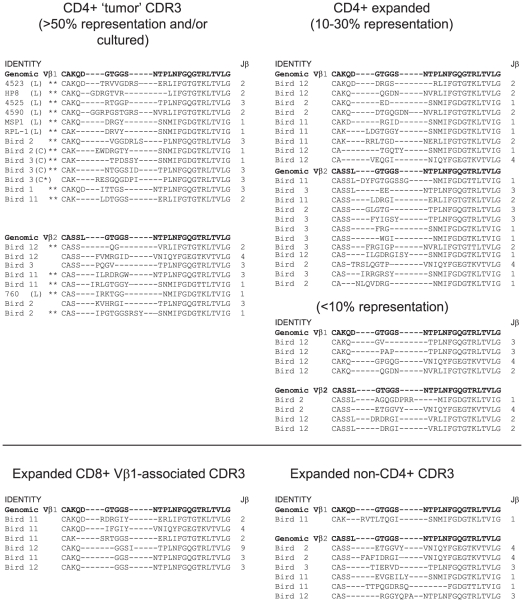
Lymphoid oncogenesis is a life threatening complication associated with a number of persistent viral infections (e.g. EBV and HTLV-1 in humans). With many of these infections it is difficult to study their natural history and the dynamics of tumor formation. Marek's Disease Virus (MDV) is a prevalent α-herpesvirus of poultry, inducing CD4+ TCRαβ+ T cell tumors in susceptible hosts. The high penetrance and temporal predictability of tumor induction raises issues related to the clonal structure of these lymphomas. Similarly, the clonality of responding CD8 T cells that infiltrate the tumor sites is unknown. Using TCRβ repertoire analysis tools, we demonstrated that MDV driven CD4+ T cell tumors were dominated by one to three large clones within an oligoclonal framework of smaller clones of CD4+ T cells. Individual birds had multiple tumor sites, some the result of metastasis (i.e. shared dominant clones) and others derived from distinct clones of transformed cells. The smaller oligoclonal CD4+ cells may represent an anti-tumor response, although on one occasion a low frequency clone was transformed and expanded after culture. Metastatic tumor clones were detected in the blood early during infection and dominated the circulating T cell repertoire, leading to MDV associated immune suppression. We also demonstrated that the tumor-infiltrating CD8+ T cell response was dominated by large oligoclonal expansions containing both "public" and "private" CDR3 sequences. The frequency of CD8+ T cell CDR3 sequences suggests initial stimulation during the early phases of infection. Collectively, our results indicate that MDV driven tumors are dominated by a highly restricted number of CD4+ clones. Moreover, the responding CD8+ T cell infiltrate is oligoclonal indicating recognition of a limited number of MDV antigens. These studies improve our understanding of the biology of MDV, an important poultry pathogen and a natural infection model of virus-induced tumor formation.


Conflict of interest statement

The authors have declared that no competing interests exist.

Figures

Figure 1
Figure 1. Clonality of established MDV cell lines revealed by TCRβ CDR3 repertoire analysis.
RNA was prepared from seven MDV cell lines and one REV-transformed cell line (AVOL-1) and subjected to (A) RTPCR with products resolved on a 1% agarose gel and (B) spectratype analysis. Each sample was tested for expression of TCR Vβ1 and Vβ2 with specific primers. C) Sequencing 16 randomly picked clones of HP18 cell line confirms monoclonal status. The nucleotide sequences of the 3′ end of Vβ, whole Dβ (with N and P nucleotide modifications), whole Jβ and the 5′ end of Cβ (left column) and translated amino acid (aa) sequences (right column) are shown. For reference the top sequence (bold) is constructed in germ line configuration with Jβ2. All spectratypes were significantly different to the TCRVβ1 or TCRVβ2 reference profile for unsorted spleen cells obtained from uninfected birds (X2, p<0.001).
Figure 2
Figure 2. Restricted TCRβ repertoire in an ovarian tumor.
Spectratype analysis on RNA isolated from an ovarian tumor from an MDV challenged Line P bird (90 dpi with pRB-1B), A) A single spectral peak for Vβ1 (left) and oligoclonal spectratype for Vβ2 (right) profile. B) Sequence analysis of Vβ1 CDR3 products (single clone) and an oligoclonal Vβ2 with two dominant CDR3 sequences at a frequency of 43% and 33%. The nucleotide sequences of the 3′ end of Vβ, whole Dβ (with N and P nucleotide modifications), whole Jβ and the 5′ end of Cβ (left column) and translated amino acid (aa) sequences (right column) are shown. The Jβ identity is indicated to right of aa sequence. For reference the top sequence (bold) is constructed in germ line configuration with Jβ3, the germ line aa sequences for Jβ are: Jβ1, SNMIFGDGTKLTVI; Jβ2, NVRLIFGTGTKLTVL; Jβ3, NTPLNFGQGTRLTVL; Jβ4, YVNIQYFGEGTKVTVL. All spectratypes were significantly different to the TCRVβ1 or TCRVβ2 reference profile for unsorted spleen cells obtained from uninfected birds (X2, p<0.001).
Figure 3
Figure 3. Dominant CDR3-lengths identified in tumors are present in sorted CD4+ cells and cultured cells.
TCRVβ1 CDR3 length distribution (spectratype) within unsorted (left column) and CD4+ populations of cells derived from tumors (middle column) and cell lines established from three tumors (right column). Samples derived from liver and kidney of two Line P birds 32dpi with RB-1B MDV. The data indicates that the dominant spectral peaks in MDV tumors lie within a transformed population of CD4+ cells. All spectratypes were significantly different to the reference profiles for unsorted or CD4+ spleen cells obtained from uninfected birds (X2, p<0.001).
Figure 4
Figure 4. TCRVβ1 CDR3-sequence identity confirms clonal identity of T cells in tumor CD4+ and cultured cells.
CDR3 amino acid sequences obtained by in silico translation of TCRVβ1 associated CDR3 nucleotide sequences. Samples derived from liver and kidney of two Line P birds 32 dpi with RB-1B MDV and represent unsorted tumors (left column) and CD4+ populations of cells derived from tumors (middle column) and cell lines established from three tumors (right column). Each sequence derives from cloned RTPCR product picked from single transformed colonies of E. coli. For reference the top sequence (bold) is constructed in germ line configuration with Jβ3, the germ line aa sequences for Jβ are: Jβ1, SNMIFGDGTKLTVI; Jβ2, NVRLIFGTGTKLTVL; Jβ3, NTPLNFGQGTRLTVL; Jβ4, YVNIQYFGEGTKVTVL. The data confirms clonal identity between MDV tumors and culturable CD4+ cells as suggested by spectratype analysis.
Figure 5
Figure 5. Spectratype analysis revealed that tumor clones can be identified in blood of MDV-infected birds.
TCRVβ1 CDR3 length distribution of tumor, spleen and peripheral blood lymphocyte (PBL) samples from bird 15 (left column) and bird 16 (right column). Tumor and spleen samples were taken at post-mortem (49 dpi with RB1B MDV) and samples of PBL at 27 and 35dpi. Dominant spectral peaks could be detected in the blood at 35 DPI which correspond to the tumor profiles which contained the expected dominant spectral peaks. The spectratype distributions of samples were compared with the TCRVβ1 or TCRVβ2 reference profiles for unsorted or CD4+ spleen cells obtained from uninfected birds by X2 analysis; statistical significance is indicated with each panel. NS = not significant (at p>0.05). Li, liver; Kd, Kidney; Ov, ovary; Spl, spleen; Musl, muscle; Hrt, heart; PBL, peripheral blood lymphocytes.
Figure 6
Figure 6. Early appearance of metastatic tumor clones in the blood of MDV-infected birds.
TCRVβ1 and TCRVβ2, CDR3 length distribution of samples obtained from B17 (left columns) and B18 (right columns). Peripheral blood lymphocytes (PBL) were isolated from samples taken throughout infection with tumor, spleen and PBL samples taken at post-mortem. Some tumor and spleen samples were subjected to positive enrichment of CD4+ T cells by magnetic bead sorting. The dominant tumor associated spectral peaks could be detected in the PBL at the early stages of infection (e.g. bird 17 Vβ1 at 16 DPI). The spectratype distributions of samples were compared with the TCRVβ1 or TCRVβ2 reference profiles for unsorted or CD4+ spleen cells obtained from uninfected birds by X2 analysis; statistical significance is indicated with each panel. NS = not significant (at p>0.05). Li, liver; Kd, Kidney, Tes, testes, Ov, ovary; Spl, spleen; PBL, peripheral blood lymphocytes.
Figure 7
Figure 7. The responding CD8+ T cell repertoire is highly focussed in tumor sites and spleen.
Spectratypes of TCR Vβ1 and Vβ2 transcripts from magnetically sorted CD8+ cells derived from multiple tumor sites of four birds (birds 11–14) are presented. The profiles show skewed distributions evident in all tumors sites within both Vβ1 and Vβ2, with some being shared between different tumors within a single host, some of which are also seen in spleen. These birds were also examined for CD4+ tumor clonality by spectratype (Figure S6) and CDR3 sequence (Figure S7) which revealed a combination of shared and tumor site-specific clones. The spectratype distributions of samples were compared with the TCRVβ1 or TCRVβ2 reference profiles from CD8β+ spleen cells obtained from uninfected birds by X2 analysis; statistical significance is indicated with each panel. NS = not significant (at p>0.05). Li, liver; Kd, Kidney; Ov, ovary; Spl, spleen.
Figure 8
Figure 8. Private and public CDR3-sequences in CD8+ T cells derived from multiple tumor sites and spleen.
CDR3 amino acid sequences obtained by in silico translation of TCRβ CDR3 nucleotide sequences for TCRVβ1 and: TCRVβ2. Samples derived from bird 11 and bird 12, magnetically sorted CD8+ cells (>99% pure) from multiple tumor sites and spleen. Each sequence derives from cloned RTPCR product picked from single transformed colonies of E. coli. Alignments are made with TCRVβ and Jβ regions, where possible remnants of the Dβ sequence are also used for alignment. For simplicity the top sequence (bold) is derived from translation of the genomic conformation of Vβ, Dβ and Jβ3. Translation of genomic sequences of Jβ segments are as follows: Jβ1, SNMIFGDGTKLTVI; Jβ2, NVRLIFGTGTKLTVL; Jβ3, NTPLNFGQGTRLTVL; Jβ4, YVNIQYFGEGTKVTVL.: The data reveals clonal structure within CD8+ T cell populations with shared clones between sites and a public TCRVβ1 CDR3 sequence shared between individuals.
Figure 9
Figure 9. Summary of CDR3 identified in MDV-infected birds or MDV transformed cell lines.
The CDR3 sequences are grouped according to Vβ usage and frequency detected in samples and/or the ability to grow in vitro (L =  established cell line; C = new cell line; C* =  new cell line from a small in vivo clone). ** CDR3 sequences detected at frequencies >70% of the sampled sequences. All data extracted from sequences presented in Figures 1, 2, 4, 7, S1, S3, and S6–S9. For comparison germ-line configuration of Vβ—Dβ—Jβ3Cβ sequence is given. Translation of genomic sequences of Jβ segments are as follows: Jβ1, SNMIFGDGTKLTVI; Jβ2, NVRLIFGTGTKLTVL; Jβ3, NTPLNFGQGTRLTVL; Jβ4, YVNIQYFGEGTKVTVL.: The identity of each Jβ is indicated to the right of each sequence.

Similar articles

Cited by

References

    1. Epstein MA. Historical background. Philos Trans R Soc Lond B Biol Sci. 2001;356:413–420. - PMC - PubMed
    1. Young LS, Rickinson AB. Epstein-Barr virus: 40 years on. Nat Rev Cancer. 2004;4:757–768. - PubMed
    1. Ishitsuka K, Tamura K. Treatment of adult T-cell leukemia/lymphoma: past, present, and future. Eur J Haematol. 2008;80:185–196. - PubMed
    1. Morrow CaFF. Marek's disease:a worldwide problem. In: Davison TF, Nair V, editors. Marek's disease An evolving Problem. London: Elsevier Academic Press; 2004. pp. 49–61.
    1. Burgess SC, Young JR, Baaten BJ, Hunt L, Ross LN, et al. Marek's disease is a natural model for lymphomas overexpressing Hodgkin's disease antigen (CD30). Proc Natl Acad Sci U S A. 2004;101:13879–13884. - PMC - PubMed

Publication types

MeSH terms

Substances