. 2011 May 5;6(5):e19472.
doi: 10.1371/journal.pone.0019472.

Candidate glutamatergic neurons in the visual system of Drosophila

Affiliations

Candidate glutamatergic neurons in the visual system of Drosophila

Shamprasad Varija Raghu et al. PLoS One. .

Abstract

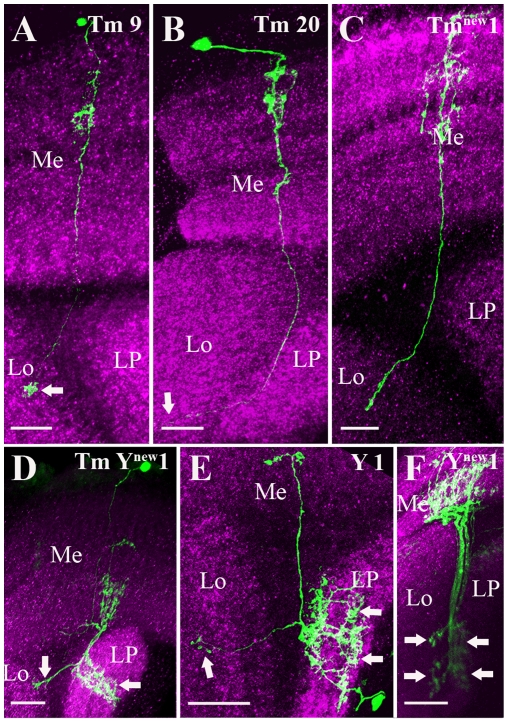
The visual system of Drosophila contains approximately 60,000 neurons that are organized in parallel, retinotopically arranged columns. A large number of these neurons have been characterized in great anatomical detail. However, studies providing direct evidence for synaptic signaling and the neurotransmitter used by individual neurons are relatively sparse. Here we present a first layout of neurons in the Drosophila visual system that likely release glutamate as their major neurotransmitter. We identified 33 different types of neurons of the lamina, medulla, lobula and lobula plate. Based on the previous Golgi-staining analysis, the identified neurons are further classified into 16 major subgroups representing lamina monopolar (L), transmedullary (Tm), transmedullary Y (TmY), Y, medulla intrinsic (Mi, Mt, Pm, Dm, Mi Am), bushy T (T), translobula plate (Tlp), lobula intrinsic (Lcn, Lt, Li), lobula plate tangential (LPTCs) and lobula plate intrinsic (LPi) cell types. In addition, we found 11 cell types that were not described by the previous Golgi analysis. This classification of candidate glutamatergic neurons fosters the future neurogenetic dissection of information processing in circuits of the fly visual system.


Conflict of interest statement

Competing Interests: Author Alexander Borst is an Academic Editor for PLoS.

Figures

Figure 1
Figure 1. GFP expression in L2 Lamina monopolar cells suggests that L2 neurons are glutamatergic.
Two L2 cells were visualized after removal of a stop cassette preceding the cDNA encoding GFP (green). Flip-out of the stop cassette allows Gal4 expressed from the dvGlut promoter to induce GFP expression (see methods). The neuropile was labeled using antisera against Dlg, a postsynaptic marker protein (magenta). L2 cells have its cell body in the outer cell body rind of the lamina. The dendritic arborization covers the entire lamina longitudinally and turns into an axon that terminates in layer M2 (arrow) of the medulla. The image represents maximum intensity projections of 30 images. Individual images were taken at every 0.5 µm along the z-axis. La - lamina and Me - medulla. Scale Bar: 20 µm.
Figure 2
Figure 2. Candidate glutamatergic projection neurons of the fly visual system.
Three groups of projection (Transmedullary (Tm), Transmedullary Y (TmY) and Y) neurons were visualized and identified as described in Fig. 1. Tm9 (A), Tm20 (B) and Tmnew1(C) neurons have their cell bodies distal to the medulla neuropile, wide spread ramifications in one or several layers of the medulla and fine terminal ramifications in the lobula (arrows). TmYnew1 (D) neuron mainly branches into M5, M8, M9 and M10 layers in the medulla. In the lobula it terminates into inner most layers (arrow) where as in the lobula plate it covers all the four layers (arrow) and cell body lies in the outer chiasm between medulla and lamina. Y1 (E) cell connects M9 layer in the medulla to the lobula and lobula plate. In the lobula Y1 cell terminates in to layer 4 and 5 where as in the lobula plate it covers almost all the layers (arrows). The cell body of Y1 cell lies outside the lobula plate. Ynew1 (F) cell has arborization in the M8–M10 layers in the medulla and sends branches to innermost layers of both lobula and lobula plate (arrows). Images A to F are maximum intensity projections of 24, 32, 16, 34, 33 and 24 images, respectively. Individual image were taken at every 0.5 µm along the z-axis. Me - medulla, Lo - lobula and LP - lobula plate. Scale bar: 10 µm for images A–C and 20 µm for images D–F.
Figure 3
Figure 3. Candidate glutamatergic medulla intrinsic neurons.
Medulla intrinsic (Mi), dorsal medulla (Dm), proximal medulla (Pm) and medulla intrinsic amacrine cells (Mi Am) neurons were visualized as described in the legend of Fig. 1. Mi1a (A) projects mainly to M1, M5 and M9–M10 layers in the medulla and in addition have smaller branches between M1 to M5 layers. Mi4 (A) covers layers M1–M5 and M8–M9 in the medulla and connects the distal with the proximal medulla neuropile. Minew1 cell (B) has arborization in layers M8–M9 and cell body in the outer chiasm region between medulla and lamina. Minew2 (C) sends terminals to M1 and M8–M9 layers in the medulla. Dm3 (D) cell extend its processes to medulla layer M2–M3. The cell bodies are found in the outer rind of medulla. Dm5 (E) cell extend its processes mostly near the serpentine layers and connects dorsal and proximal region in the medulla. The cell body of Dm5 cell lies in the outer rind of medulla. Dmnew1 (F) cell cover mostly the dorsal part of the medulla spreading over layers M1 to M4 and has characteristic blob like protrusion at the terminals. Pm2 (G) cells have their processes in M8–M9 layers in the medulla and their cell bodies are found in the posterior part of the medulla. Mi Amnew1 (H) cell has arborization in the M5–M7 layers in the medulla. Images A to H are maximum intensity projections of 31, 29, 14, 9, 25, 36, 31 and 44 images, respectively. Individual image were taken at every 0.5 µm along the z-axis. Scale Bar: 20 µm for A–C, 10 µm for D–F and 20 µm for G–H.
Figure 4
Figure 4. Candidate glutamatergic Medulla tangential (Mt) cells.
The cells are visualized as described in the legend of Fig. 1. Mt cells run across the medulla, mostly in parallel and close to the serpentine layer. The cell bodies of most Mt neurons are situated anterior to the medulla neuropile. Mt11 (A) cell covers almost complete visual field and run across the serpentine layer. Mtnew1 (B) also spread across complete medulla neuropile, while Mtnew2 cell (C) covers only part of the visual field. In A and B, horizontal sections were taken in the dorsal region of the brain. In C, frontal sections were taken from the posterior side of the brain. Images A to C are maximum intensity projections of 11, 36 and 17 images, respectively. Individual image were taken at every 0.5 µm along the z-axis. Me - medulla, Lo - lobula and LP - lobula plate. Scale Bar: 20 µm for A, 40 µm for B and 20 µm for C.
Figure 5
Figure 5. Candidate glutamatergic T Bushy (T) cells.
T3 (A) and T5 (B) cells were visualized and identified as described in the legend of Fig. 1. The cell body of T3 (A) cell clustered posterior in the area between the medulla and lobula plate. In the medulla, the T3 neurons arborize within single columns of the proximal medulla, by passing the innermost layer and finally terminate in to layer 3 in the lobula. The cell bodies of T5 (B) cells lie in the rind of the lobula plate. T5 cells connect innermost of layer of the lobula to the lobula plate neuropile. Images A and B are the maximum intensity projections of 35 and 10 images. Individual image were taken at every 0.5 µm along the z-axis. Me - medulla, Lo - lobula and LP - lobula plate. Scale Bar: 20 µm.
Figure 6
Figure 6. Candidate glutamatergic Translobula plate (Tlp) cells.
Tlp cells are identified and visualized as described in the legend of Fig. 1. Tlp cells connect the lobula with the lobula plate. Tlp1 (A) has its processes in layer 5 of the lobula and all the four layers in the lobula plate. Tlp3 (B) has its processes in layer 4 of the lobula and layer 2–4 in the lobula plate. Tlpnew1 (C) sends processes into layer 4, 5 and 6 in the lobula. In the lobula plate Tlpnew1 processes cover all the four layers. Images A to C are the maximum intensity projections of 17, 55 and 29 images, respectively. Individual image were taken at every 0.5 µm along the z-axis. Lo - Lobula and LP - Lobula Plate. Scale Bar: 20 µm.
Figure 7
Figure 7. Candidate glutamatergic columnar, tangential and intrinsic cells of the lobula.
Lobula columnar (Lcn) cells branch within different layers of the lobula, but mostly spare the most posterior layer, adjacent to the lobula plate, where T5 cells ramify. Putative axons of different Lcn cells are bundled together and project into the central brain. Lcnnew2 (A) arborizes into layers 3–5 in the lobula. Lcn4 (B), Lcn5 (C) and Lcn8 (D) cover lobula layers 2–4, 4–6 and 4–5 respectively. Lobula tangential (Lt) cells mostly cover different layers within in the lobula. Lt4 (E) sends branches into layer 5 and 6 in the lobula where as Lt6 (F) covers layer 2–5 in the lobula. The putative axons of different Lt cells projects to the different region in the central brain. The cell bodies of Lt cells are located right outside the lobula. Lobula intrinsic (Li) cells too show stratifications within the specific layers of the lobula. These cells differ from Lcn and Lt cells in having relatively short distance axons terminating right outside the lobula. Li1 (G) cell sends arborization into layers 4–6 in the lobula. Images A to G are the maximum intensity projections of 47, 17, 27, 45, 52, 21 and 21 images, respectively. Individual image were taken at every 0.5 µm along the z-axis. The cells are identified and visualized as described in the legend of Fig. 1. Lo - Lobula, LP - Lobula Plate and CB- Cell Body. Scale Bar: 20 µm.
Figure 8
Figure 8. Candidate glutamatergic lobula plate intrinsic cells.
Two groups of lobula plate intrinsic cells are labeled: Horizontally Sensitive South (HSS) and lobula Plate intrinsic (LPi) cells. HSS (A) cell represent one of the lobula plate tangential cells (LPTCs) that respond to large-field visual motion and extend its wide spread dendrites in the most ventral part of the lobula plate. LPi (B) cell cover layers 2–4 in the lobula plate. The cell body is located right outside the lobula plate. The cells are identified and visualized as described in the legend of Fig. 1. Images A and B are the maximum intensity projections of 52 and 14 images. Individual image were taken at every 0.5 µm along the z-axis. Lo – Lobula and LP - Lobula Plate. Scale Bar: 20 µm for A and 10 µm for B.
Figure 9
Figure 9. Schematic diagram of the different neuropile layers occupied by the processes of all candidate glutamatergic neuronal types identified.
The medulla is subdivided in to 10 layers, the lobula into 6 layers and the lobula plate into 4 layers . Here the shaded boxes indicate the layers in the lamina, medulla, lobula and lobula plate where each neuron ramifies.

References

    1. Fischbach KF, Dittrich APM. The optic lobe of Drosophila melanogaster. I. A Golgi analysis of wild-type structure. Cell Tissue Res. 1989;258:441–475.
    1. Strausfeld NJ. Atlas of an Insect Brain. 1976a. Springer: Berlin.
    1. Strausfeld NJ. Zettler F, Weiler R, editors. Mosaic organization, layers and visual pathways in the insect brain. Neural Principles of Vision. 1976b. pp. 245–279. Springer: Berlin.
    1. Strausfeld NJ. Ali M A, editor. Functional anatomy of the blowfly visual system. Photoreception and Vision in Invertebrates, ed. 1984. pp. 483–522. New York: Plenum Press.
    1. Joesch M, Schnell B, Raghu SV, Reiff DF, Borst A. ON and OFF pathways in Drosophila motion vision. Nature. 2010;468:300–304. - PubMed

Publication types

LinkOut - more resources