

Feedback control architecture and the bacterial chemotaxis network
- PMID: 21573199
- PMCID: PMC3088647
- DOI: 10.1371/journal.pcbi.1001130
Feedback control architecture and the bacterial chemotaxis network
Abstract
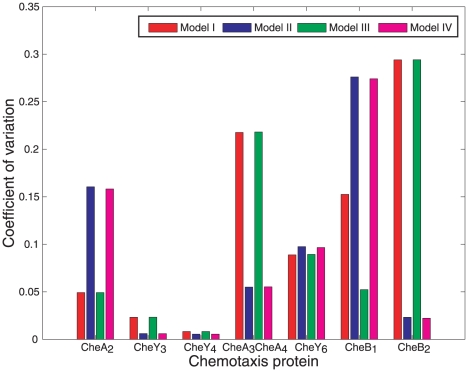
Bacteria move towards favourable and away from toxic environments by changing their swimming pattern. This response is regulated by the chemotaxis signalling pathway, which has an important feature: it uses feedback to 'reset' (adapt) the bacterial sensing ability, which allows the bacteria to sense a range of background environmental changes. The role of this feedback has been studied extensively in the simple chemotaxis pathway of Escherichia coli. However it has been recently found that the majority of bacteria have multiple chemotaxis homologues of the E. coli proteins, resulting in more complex pathways. In this paper we investigate the configuration and role of feedback in Rhodobacter sphaeroides, a bacterium containing multiple homologues of the chemotaxis proteins found in E. coli. Multiple proteins could produce different possible feedback configurations, each having different chemotactic performance qualities and levels of robustness to variations and uncertainties in biological parameters and to intracellular noise. We develop four models corresponding to different feedback configurations. Using a series of carefully designed experiments we discriminate between these models and invalidate three of them. When these models are examined in terms of robustness to noise and parametric uncertainties, we find that the non-invalidated model is superior to the others. Moreover, it has a 'cascade control' feedback architecture which is used extensively in engineering to improve system performance, including robustness. Given that the majority of bacteria are known to have multiple chemotaxis pathways, in this paper we show that some feedback architectures allow them to have better performance than others. In particular, cascade control may be an important feature in achieving robust functionality in more complex signalling pathways and in improving their performance.
Conflict of interest statement
The authors have declared that no competing interests exist.
Figures
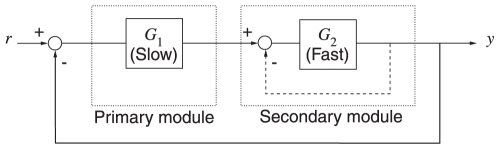
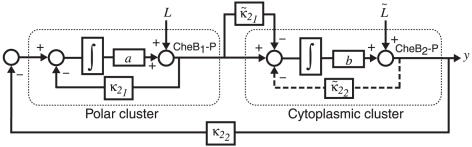
 is slow relative to
  . Cascade control involves placing a negative feedback loop (dashed line) around the fast secondary module. This scheme helps reduce the sensitivity of the system's output to uncertainties in the subsystems
  and
and  .
.
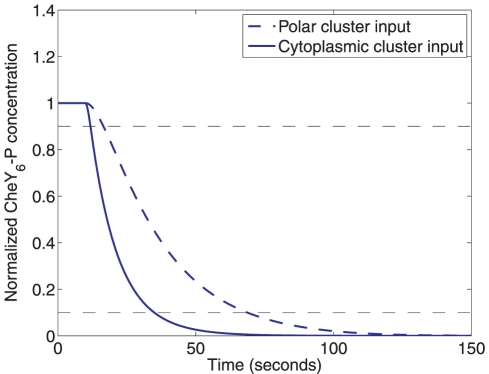
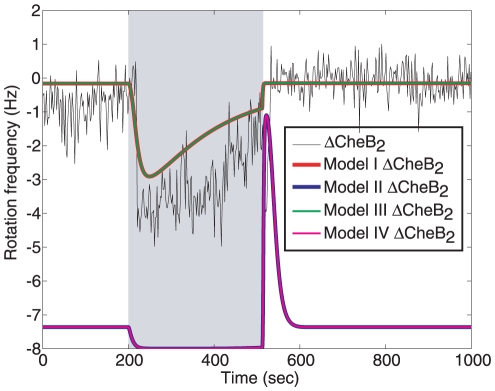
 = 1 µM to
  = 0 µM, dashed) and at the cytoplasmic cluster (from
  = 1 µM to
  = 0 µM, solid). Such a decrease in active receptors can be due to a step increase in sensed ligand. A step decrease in active polar cluster receptors results in a slower fall in the normalized CheY6-P concentration (90%-10% fall time: 50.57 sec) than would an identical change in the number of active cytoplasmic cluster receptors (90%-10% fall time: 21.98 sec).
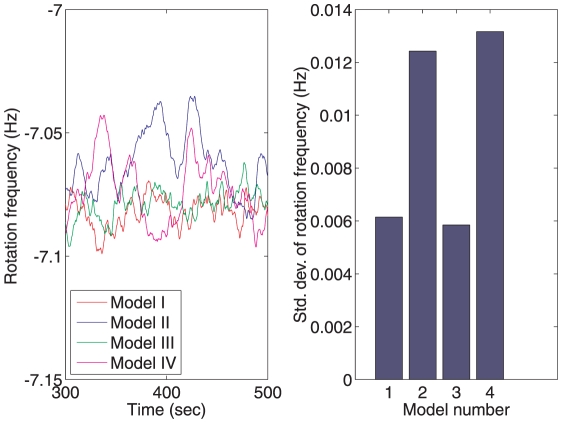
 , where
  ). Bottom: Constant ligand to polar cluster, sinusoidal to cytoplasmic cluster (
 , where
  ).
).
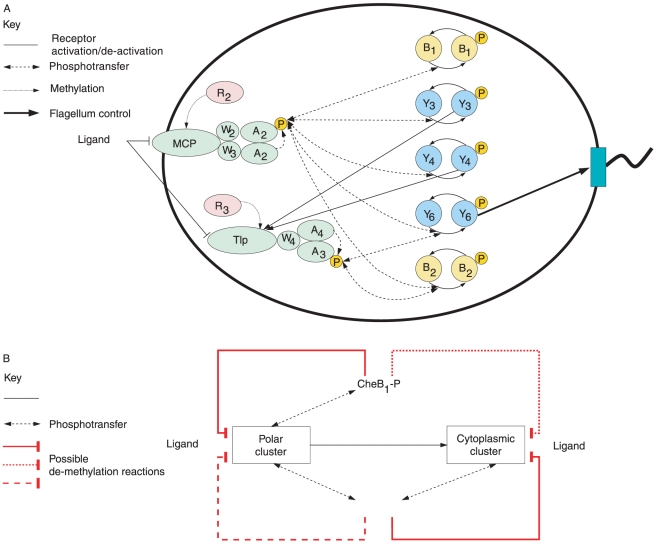
 corresponds to
  in the chemotaxis model,
  to
to  ,
,  to
to  and
and  to
to  . Levels of CheB1-P and CheB2-P exhibit exact adaptation to step changes in ligand concentration
  . We assume
  , mirroring the faster dynamics of the cytoplasmic cluster relative to the polar cluster.
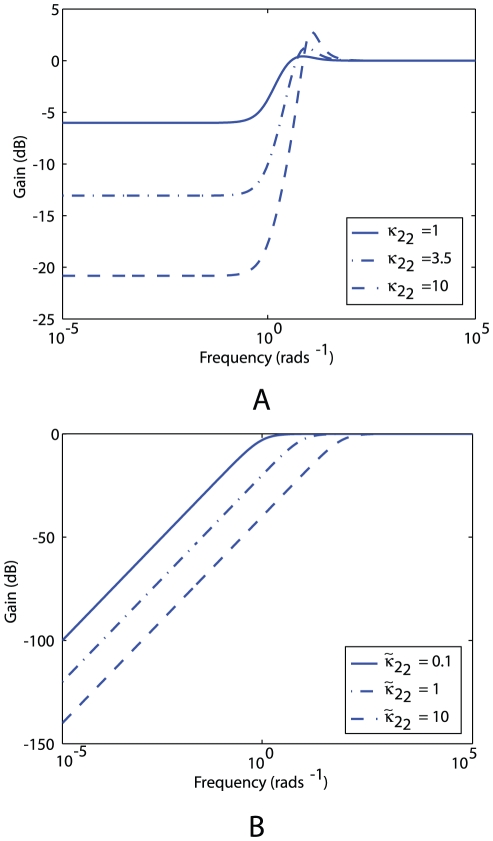
 and different values of gain
  , which corresponds to the feedback strength of CheB2-P de-methylating active polar cluster receptors. With these gains the system is structurally similar to Model III. (B) Sensitivity function of the block corresponding to the cytoplasmic cluster in the linear model (1), for different values of feedback gain
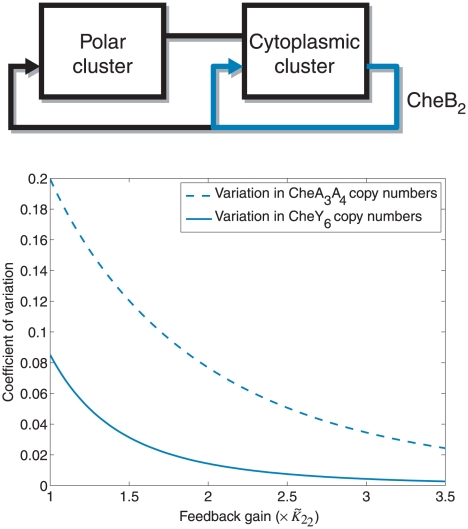
  , which corresponds to the feedback strength of CheB2-P de-methylating active cytoplasmic cluster receptors. The frequency domain sensitivity function is
  (see Text S1).
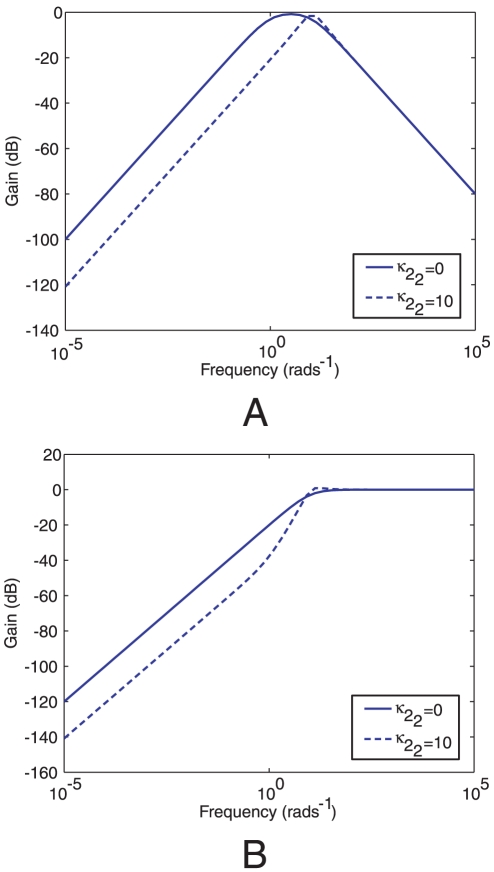
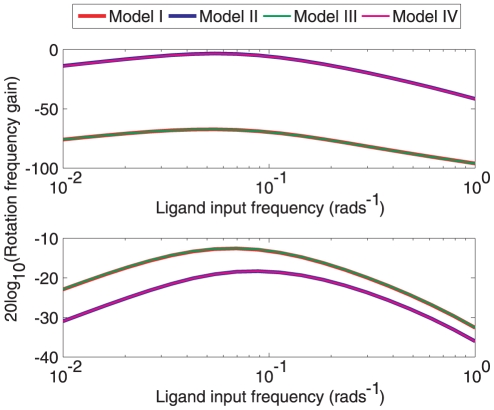
 to Y in the linear system (1) corresponding to Models I (
 ) and III (
 ). (A) Bode magnitude plots from L to Y. (B) Bode magnitude plots from
  to Y.
to Y.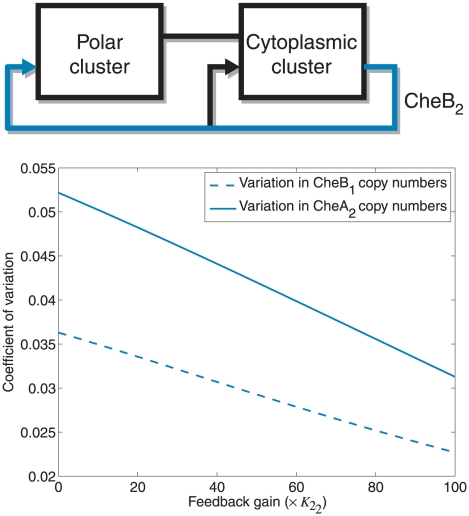
References
-
- Tyson JJ, Chen KC, Novak B. Sniffers, buzzers, toggles and blinkers: dynamics of regulatory and signaling pathways in the cell. Curr Opin Cell Biol. 2003;15:221–231. - PubMed
-
- Hartwell LH, Hopfield JJ, Leibler S, Murray AW. From molecular to modular cell biology. Nature. 1999:C47–53. - PubMed
-
- Wadhams GH, Armitage JP. Making sense of it all: Bacterial chemotaxis. Nat Rev Mol Cell Biol. 2004;5:1024–1037. - PubMed
Publication types
MeSH terms
Substances
Grants and funding
LinkOut - more resources
Full Text Sources
