

Gene expression in the rodent brain is associated with its regional connectivity
- PMID: 21573208
- PMCID: PMC3088660
- DOI: 10.1371/journal.pcbi.1002040
Gene expression in the rodent brain is associated with its regional connectivity
Abstract
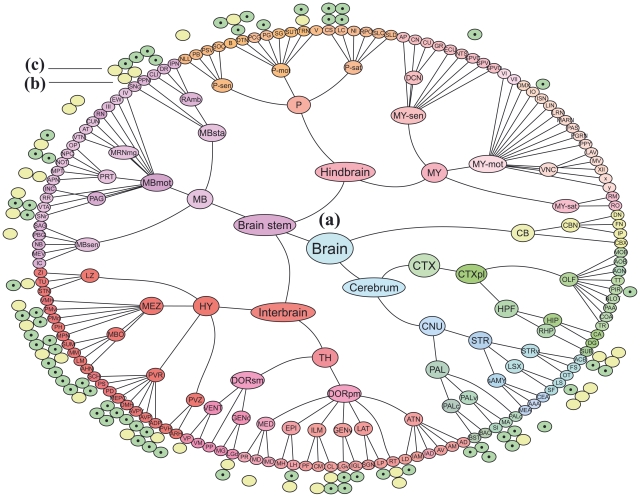
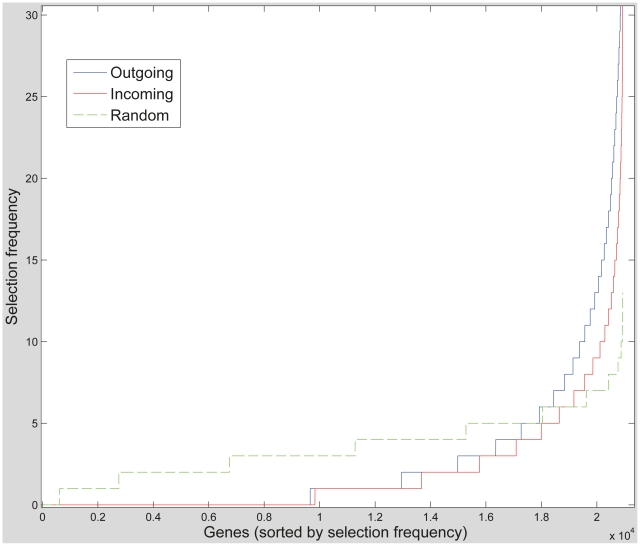
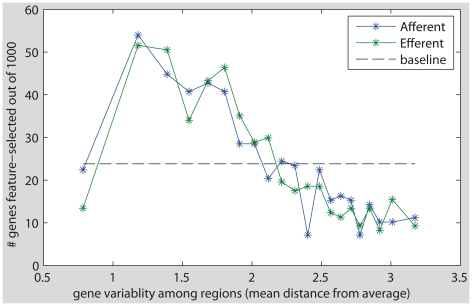
The putative link between gene expression of brain regions and their neural connectivity patterns is a fundamental question in neuroscience. Here this question is addressed in the first large scale study of a prototypical mammalian rodent brain, using a combination of rat brain regional connectivity data with gene expression of the mouse brain. Remarkably, even though this study uses data from two different rodent species (due to the data limitations), we still find that the connectivity of the majority of brain regions is highly predictable from their gene expression levels-the outgoing (incoming) connectivity is successfully predicted for 73% (56%) of brain regions, with an overall fairly marked accuracy level of 0.79 (0.83). Many genes are found to play a part in predicting both the incoming and outgoing connectivity (241 out of the 500 top selected genes, p-value<1e-5). Reassuringly, the genes previously known from the literature to be involved in axon guidance do carry significant information about regional brain connectivity. Surveying the genes known to be associated with the pathogenesis of several brain disorders, we find that those associated with schizophrenia, autism and attention deficit disorder are the most highly enriched in the connectivity-related genes identified here. Finally, we find that the profile of functional annotation groups that are associated with regional connectivity in the rodent is significantly correlated with the annotation profile of genes previously found to determine neural connectivity in C. elegans (Pearson correlation of 0.24, p<1e-6 for the outgoing connections and 0.27, p<1e-5 for the incoming). Overall, the association between connectivity and gene expression in a specific extant rodent species' brain is likely to be even stronger than found here, given the limitations of current data.
Conflict of interest statement
The authors have declared that no competing interests exist.
Figures
Similar articles
-
Large-Scale Analysis of Gene Expression and Connectivity in the Rodent Brain: Insights through Data Integration.Front Neuroinform. 2011 Jul 29;5:12. doi: 10.3389/fninf.2011.00012. eCollection 2011. Front Neuroinform. 2011. PMID: 21863139 Free PMC article.
-
Gene expression of Caenorhabditis elegans neurons carries information on their synaptic connectivity.PLoS Comput Biol. 2006 Dec 8;2(12):e167. doi: 10.1371/journal.pcbi.0020167. PLoS Comput Biol. 2006. PMID: 17154715 Free PMC article.
-
Relationships between gene expression and brain wiring in the adult rodent brain.PLoS Comput Biol. 2011 Jan 6;7(1):e1001049. doi: 10.1371/journal.pcbi.1001049. PLoS Comput Biol. 2011. PMID: 21253556 Free PMC article.
-
Large-scale functional connectivity networks in the rodent brain.Neuroimage. 2016 Feb 15;127:496-509. doi: 10.1016/j.neuroimage.2015.12.017. Epub 2015 Dec 17. Neuroimage. 2016. PMID: 26706448 Review.
-
Functional connectivity in the brain--is it an elusive concept?Neurosci Biobehav Rev. 2005 Jan;28(8):827-36. doi: 10.1016/j.neubiorev.2004.10.009. Neurosci Biobehav Rev. 2005. PMID: 15642624 Review.
Cited by
-
Global analysis of gene expression and projection target correlations in the mouse brain.Brain Inform. 2015 Jun;2(2):107-117. doi: 10.1007/s40708-015-0014-2. Epub 2015 Mar 20. Brain Inform. 2015. PMID: 27747484 Free PMC article.
-
Coupling of gene expression in medial prefrontal cortex and nucleus accumbens after neonatal ventral hippocampal lesions accompanies deficits in sensorimotor gating and auditory processing in rats.Neuropharmacology. 2013 Dec;75:38-46. doi: 10.1016/j.neuropharm.2013.06.003. Epub 2013 Jun 26. Neuropharmacology. 2013. PMID: 23810830 Free PMC article.
-
Uncovering Statistical Links Between Gene Expression and Structural Connectivity Patterns in the Mouse Brain.Neuroinformatics. 2021 Oct;19(4):649-667. doi: 10.1007/s12021-021-09511-0. Epub 2021 Mar 11. Neuroinformatics. 2021. PMID: 33704701 Free PMC article.
-
Neuronal Activities in the Mouse Visual Cortex Predict Patterns of Sensory Stimuli.Neuroinformatics. 2018 Oct;16(3-4):473-488. doi: 10.1007/s12021-018-9357-1. Neuroinformatics. 2018. PMID: 29404932
-
Connectomes: from a sparsity of networks to large-scale databases.Front Neuroinform. 2023 Jun 12;17:1170337. doi: 10.3389/fninf.2023.1170337. eCollection 2023. Front Neuroinform. 2023. PMID: 37377946 Free PMC article. Review.
References
-
- Kania A, Johnson RL, Jessell TM. Coordinate Roles for LIM Homeobox Genes in Directing the Dorsoventral Trajectory of Motor Axons in the Vertebrate Limb. Cell. 2000;102:161–173. - PubMed
-
- Hobert O. Behavioral plasticity in C. elegans: Paradigms, circuits, genes. J Neurobiol. 2003;54:203–223. - PubMed
-
- Araujo SJ, Tear G. Axon guidance mechanisms and molecules: lessons from invertebrates. Nat Rev Neurosci. 2003;4:910–922. - PubMed
-
- Huber AB, Kolodkin AL, Ginty DD, Cloutier JF. Signaling at the growth cone: Ligand-Receptor Complexes and the Control of Axon Growth and Guidance. Annu Rev Neurosci. 2003;26:509–563. - PubMed
-
- Tessier ML, Goodman CS. The Molecular Biology of Axon Guidance. Science. 1996;274:1123–1133. - PubMed
Publication types
MeSH terms
LinkOut - more resources
Full Text Sources
