

Size and usage patterns of private TB drug markets in the high burden countries
- PMID: 21573227
- PMCID: PMC3087727
- DOI: 10.1371/journal.pone.0018964
Size and usage patterns of private TB drug markets in the high burden countries
Abstract
Background: Tuberculosis (TB) control is considered primarily a public health concern, and private sector TB treatment has attracted less attention. Thus, the size and characteristics of private sector TB drug sales remain largely unknown.
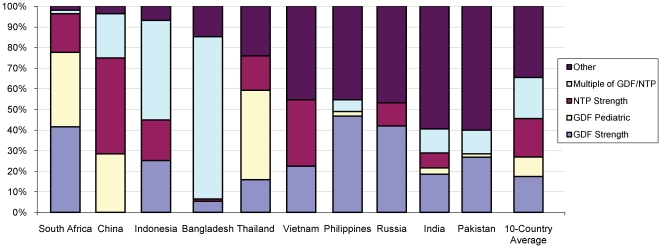
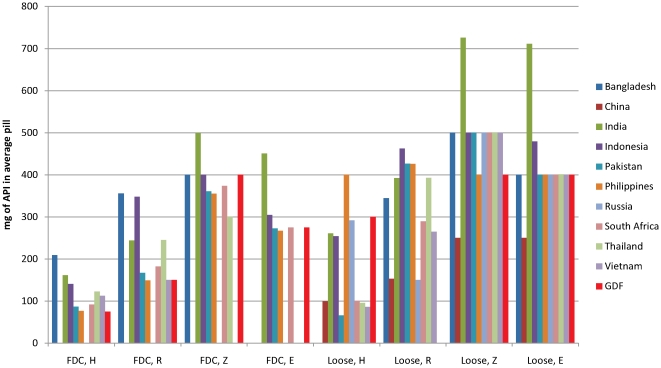
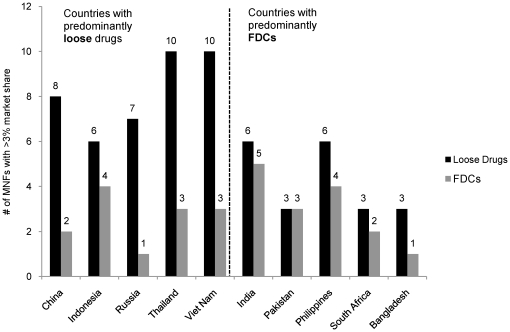
Methodology/principal findings: We used IMS Health data to analyze private TB drug consumption in 10 high burden countries (HBCs), after first mapping how well IMS data coverage overlapped with private markets. We defined private markets as any channels not used or influenced by national TB programs. Private markets in four countries--Pakistan, the Philippines, Indonesia and India--had the largest relative sales volumes; annually, they sold enough first line TB drugs to provide 65-117% of the respective countries' estimated annual incident cases with a standard 6-8 month regimen. First line drug volumes in five countries were predominantly fixed dose combinations (FDCs), but predominantly loose drugs in the other five. Across 10 countries, these drugs were available in 37 (loose drug) plus 74 (FDCs) distinct strengths. There were 54 distinct, significant first line manufacturers (range 2-11 per country), and most companies sold TB drugs in only a single study country. FDC markets were, however, more concentrated, with 4 companies capturing 69% of FDC volume across the ten countries. Among second line drugs, fluoroquinolones were widely available, with significant volumes used for TB in India, Pakistan and Indonesia. However, certain WHO-recommended drugs were not available and in general there were insufficient drug volumes to cover the majority of the expected burden of multidrug-resistant TB (MDR-TB).
Conclusions/significance: Private TB drug markets in several HBCs are substantial, stable, and complicated. This calls for appropriate policy and market responses, including expansion of Public-Private Mix (PPM) programs, greater reach, flexibility and appeal of public programs, regulatory and quality enforcement, and expansion of public MDR-TB treatment programs.
Conflict of interest statement
Figures
References
-
- WHO. Global tuberculosis control: WHO report 2010. Geneva, Switzerland: World Health Organization; 2010.
-
- WHO. Treatment of tuberculosis: Guidelines, 4th edition. Geneva: World Health Organization; 2009.
-
- Wells WA, Konduri N, Chen C, Lee D, Ignatius HR, et al. TB regimen change in the high burden countries. Int J Tuberc Lung Dis. 2010;14:1538–1547. - PubMed
-
- Uplekar MW, Shepard DS. Treatment of tuberculosis by private general practitioners in India. Tubercle. 1991;72:284–290. - PubMed
Publication types
MeSH terms
Substances
LinkOut - more resources
Full Text Sources
Medical
