. 2011 May 4;6(5):e19467.
doi: 10.1371/journal.pone.0019467.

The use of Twitter to track levels of disease activity and public concern in the U.S. during the influenza A H1N1 pandemic

Affiliations

The use of Twitter to track levels of disease activity and public concern in the U.S. during the influenza A H1N1 pandemic

Alessio Signorini et al. PLoS One. .

Abstract

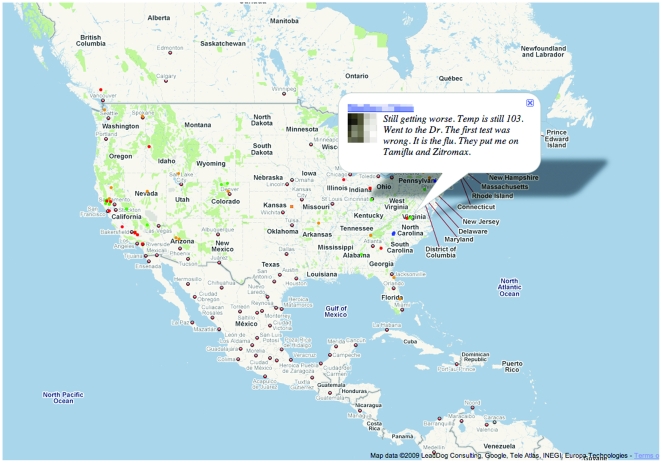
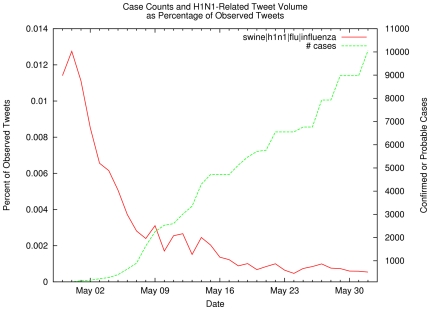
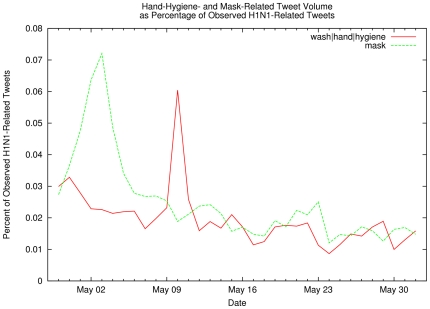
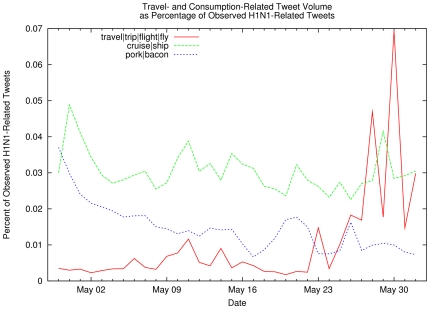
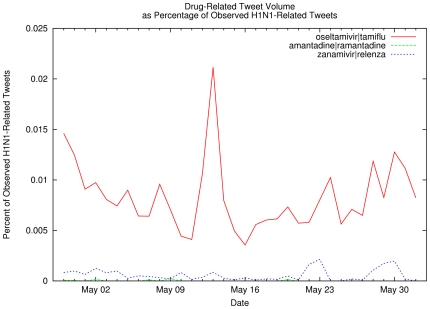
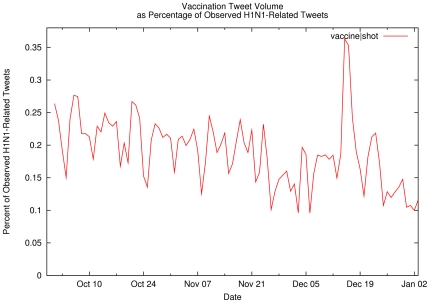
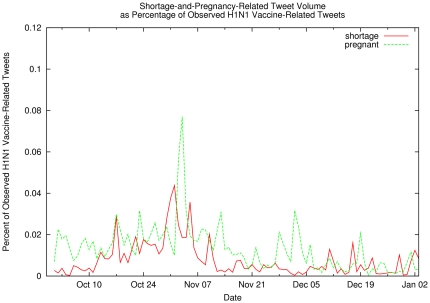
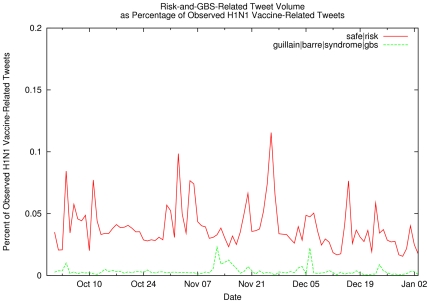
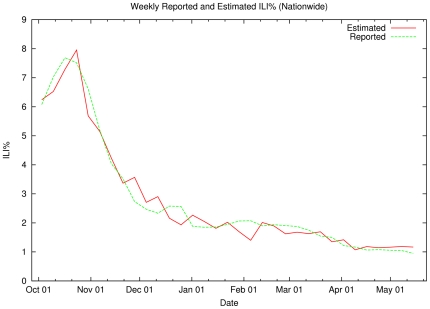
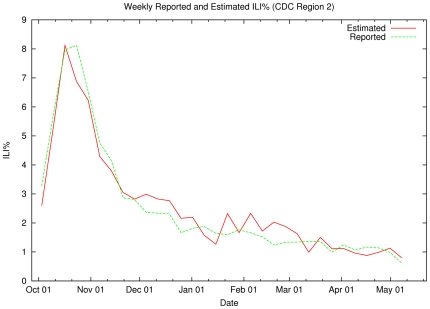
Twitter is a free social networking and micro-blogging service that enables its millions of users to send and read each other's "tweets," or short, 140-character messages. The service has more than 190 million registered users and processes about 55 million tweets per day. Useful information about news and geopolitical events lies embedded in the Twitter stream, which embodies, in the aggregate, Twitter users' perspectives and reactions to current events. By virtue of sheer volume, content embedded in the Twitter stream may be useful for tracking or even forecasting behavior if it can be extracted in an efficient manner. In this study, we examine the use of information embedded in the Twitter stream to (1) track rapidly-evolving public sentiment with respect to H1N1 or swine flu, and (2) track and measure actual disease activity. We also show that Twitter can be used as a measure of public interest or concern about health-related events. Our results show that estimates of influenza-like illness derived from Twitter chatter accurately track reported disease levels.


Conflict of interest statement

Competing Interests: The authors have declared that no competing interests exist.

Figures

Figure 1
Figure 1. Influenza-Related Twitter Map.
Color-coded dots represent tweets issued by users (shown at the users' self-declared home location). Hovering over the dot displays the content of the tweet; here, the user name is intentionally obscured. A client-side JavaScript application updates the map in near-real time, showing the 500 most recent tweets matching the preselected influenza-related keywords.
Figure 2
Figure 2. Case Counts and H1N1-Related Tweet Volume as Percentage of Observed Tweet Volume.
The red line represents the number of H1N1-related tweets (i.e., containing keywords swine, flu, influenza, or h1n1) as a percentage of the observed daily tweets, while the green line shows the number of confirmed or probable H1N1 cases. Note that the volume of tweets pertaining to influenza steadily declined even though the number of cases continued to grow, reflecting a lessening of public concern about the severity of the pandemic.
Figure 3
Figure 3. Hand-Hygiene- and Mask-Related Tweet Volume as Percentage of Observed H1N1-Related Tweets.
Percentage of observed influenza-related tweets that also contain hand-hygiene-related keywords (red line) or mask-related keywords (green line). Spikes correspond to increased interest in these particular disease countermeasures, perhaps in reaction to, e.g., a report in the popular media.
Figure 4
Figure 4. Travel- and Consumption-Related Tweet Volume as Percentage of Observed H1N1-Related Tweets.
Percentage of observed influenza-related tweets that also contain travel-related keywords (red and green lines) or pork consumption-related keywords (blue line). The relative rate of public concern about pork consumption fell steadily during the month of May, in contrast to increased public concerns about travel-related disease transmission.
Figure 5
Figure 5. Drug-Related Tweet Volume as Percentage of Observed H1N1-Related Tweets.
Percentage of observed influenza-related tweets containing references to specific anti-viral drugs.
Figure 6
Figure 6. Vaccination Tweet Volume as Percentage of Observed H1N1-Related Tweets.
Percentage of observed influenza-related tweets containing vaccination-related terms.
Figure 7
Figure 7. Shortage-and-Pregnancy-Related Tweet Volume as Percentage of Observed H1N1 Vaccination-Related Tweets.
Percentage of observed H1N1 vaccination-related tweets containing terms related to pregnancy (green line) or vaccine shortage (red line). The relatively low rates observed may indicate either a lack of public concern or a lack of public awareness.
Figure 8
Figure 8. Risk-and-GBS-Related Tweet Volume as Percentage of Observed H1N1 Vaccination-Related Tweets.
Percentage of observed H1N1 vaccination-related tweets containing terms related to risk perception (red line) or Guillain–Barré syndrome (green line).
Figure 9
Figure 9. Weekly Reported and Estimated ILI% (Nationwide).
The green line shows the CDC's measured ILI% for the 33-week period starting in Week 40 (October 2009) through Week 20 (May 2010). The red line shows the output of a leaving-one-out cross-validation test of our SVM-based estimator. Each estimated datapoint is produced by applying a model to the specified week of tweets after training on the other 32 weeks of data and their respective CDC ILI% values.
Figure 10
Figure 10. Weekly Reported and Estimated ILI% (CDC Region 2).
The green line shows the CDC's measured ILI% for Region 2 (New Jersey/New York) for the 33-week period starting in Week 40 (October 2009) through Week 20 (May 2010). The red line shows the output of our SVM-based estimator when applied to Region 2 tweet data. The estimator is first trained on all data from outside Region 2 and their respective region's CDC ILI% values.

References

    1. National Library of Medicine (NLM)/National Institutes of Health. NLM Technical Bulletin: MLA 2006, NLM online users' meeting remarks. 2006. Available: http://www.nlm.nih.gov/pubs/techbull/ja06/ja06_mla_dg.html. Accessed 2008 April 25.
    1. Polgreen PM, Chen Y, Pennock DM, Nelson FD. Using internet searches for influenza surveillance. Clin Infect Dis. 2008;47(11):1443–8. - PubMed
    1. Ginsberg J, Mohebbi MH, Patel RS, Brammer L, Smolinski MS, et al. Detecting influenza epidemics using search engine query data. Nature. 2009;457(7232):1012–4. - PubMed
    1. Lorica, B Twitter by the numbers: O'Reilly Radar, April 14, 2010. 2010. Available: http://radar.oreilly.com/2010/04/twitter-by-the-numbers.html. Accessed 2010 August 15.
    1. Twitter Study – August 2009. 2009. Pear Analytics. Available: http://www.pearanalytics.com/blog/wp-content/uploads/2010/05/Twitter-Stu.... Accessed 2010 August 15.

Publication types