. 2011 Aug;54(2):620-30.
doi: 10.1002/hep.24417.

Hepatocyte proliferation and hepatomegaly induced by phenobarbital and 1,4-bis [2-(3,5-dichloropyridyloxy)] benzene is suppressed in hepatocyte-targeted glypican 3 transgenic mice

Affiliations

Hepatocyte proliferation and hepatomegaly induced by phenobarbital and 1,4-bis [2-(3,5-dichloropyridyloxy)] benzene is suppressed in hepatocyte-targeted glypican 3 transgenic mice

Chih-Wen Lin et al. Hepatology. 2011 Aug.

Erratum in

  • Hepatology. 2014 Sep;60(3):1116

Abstract

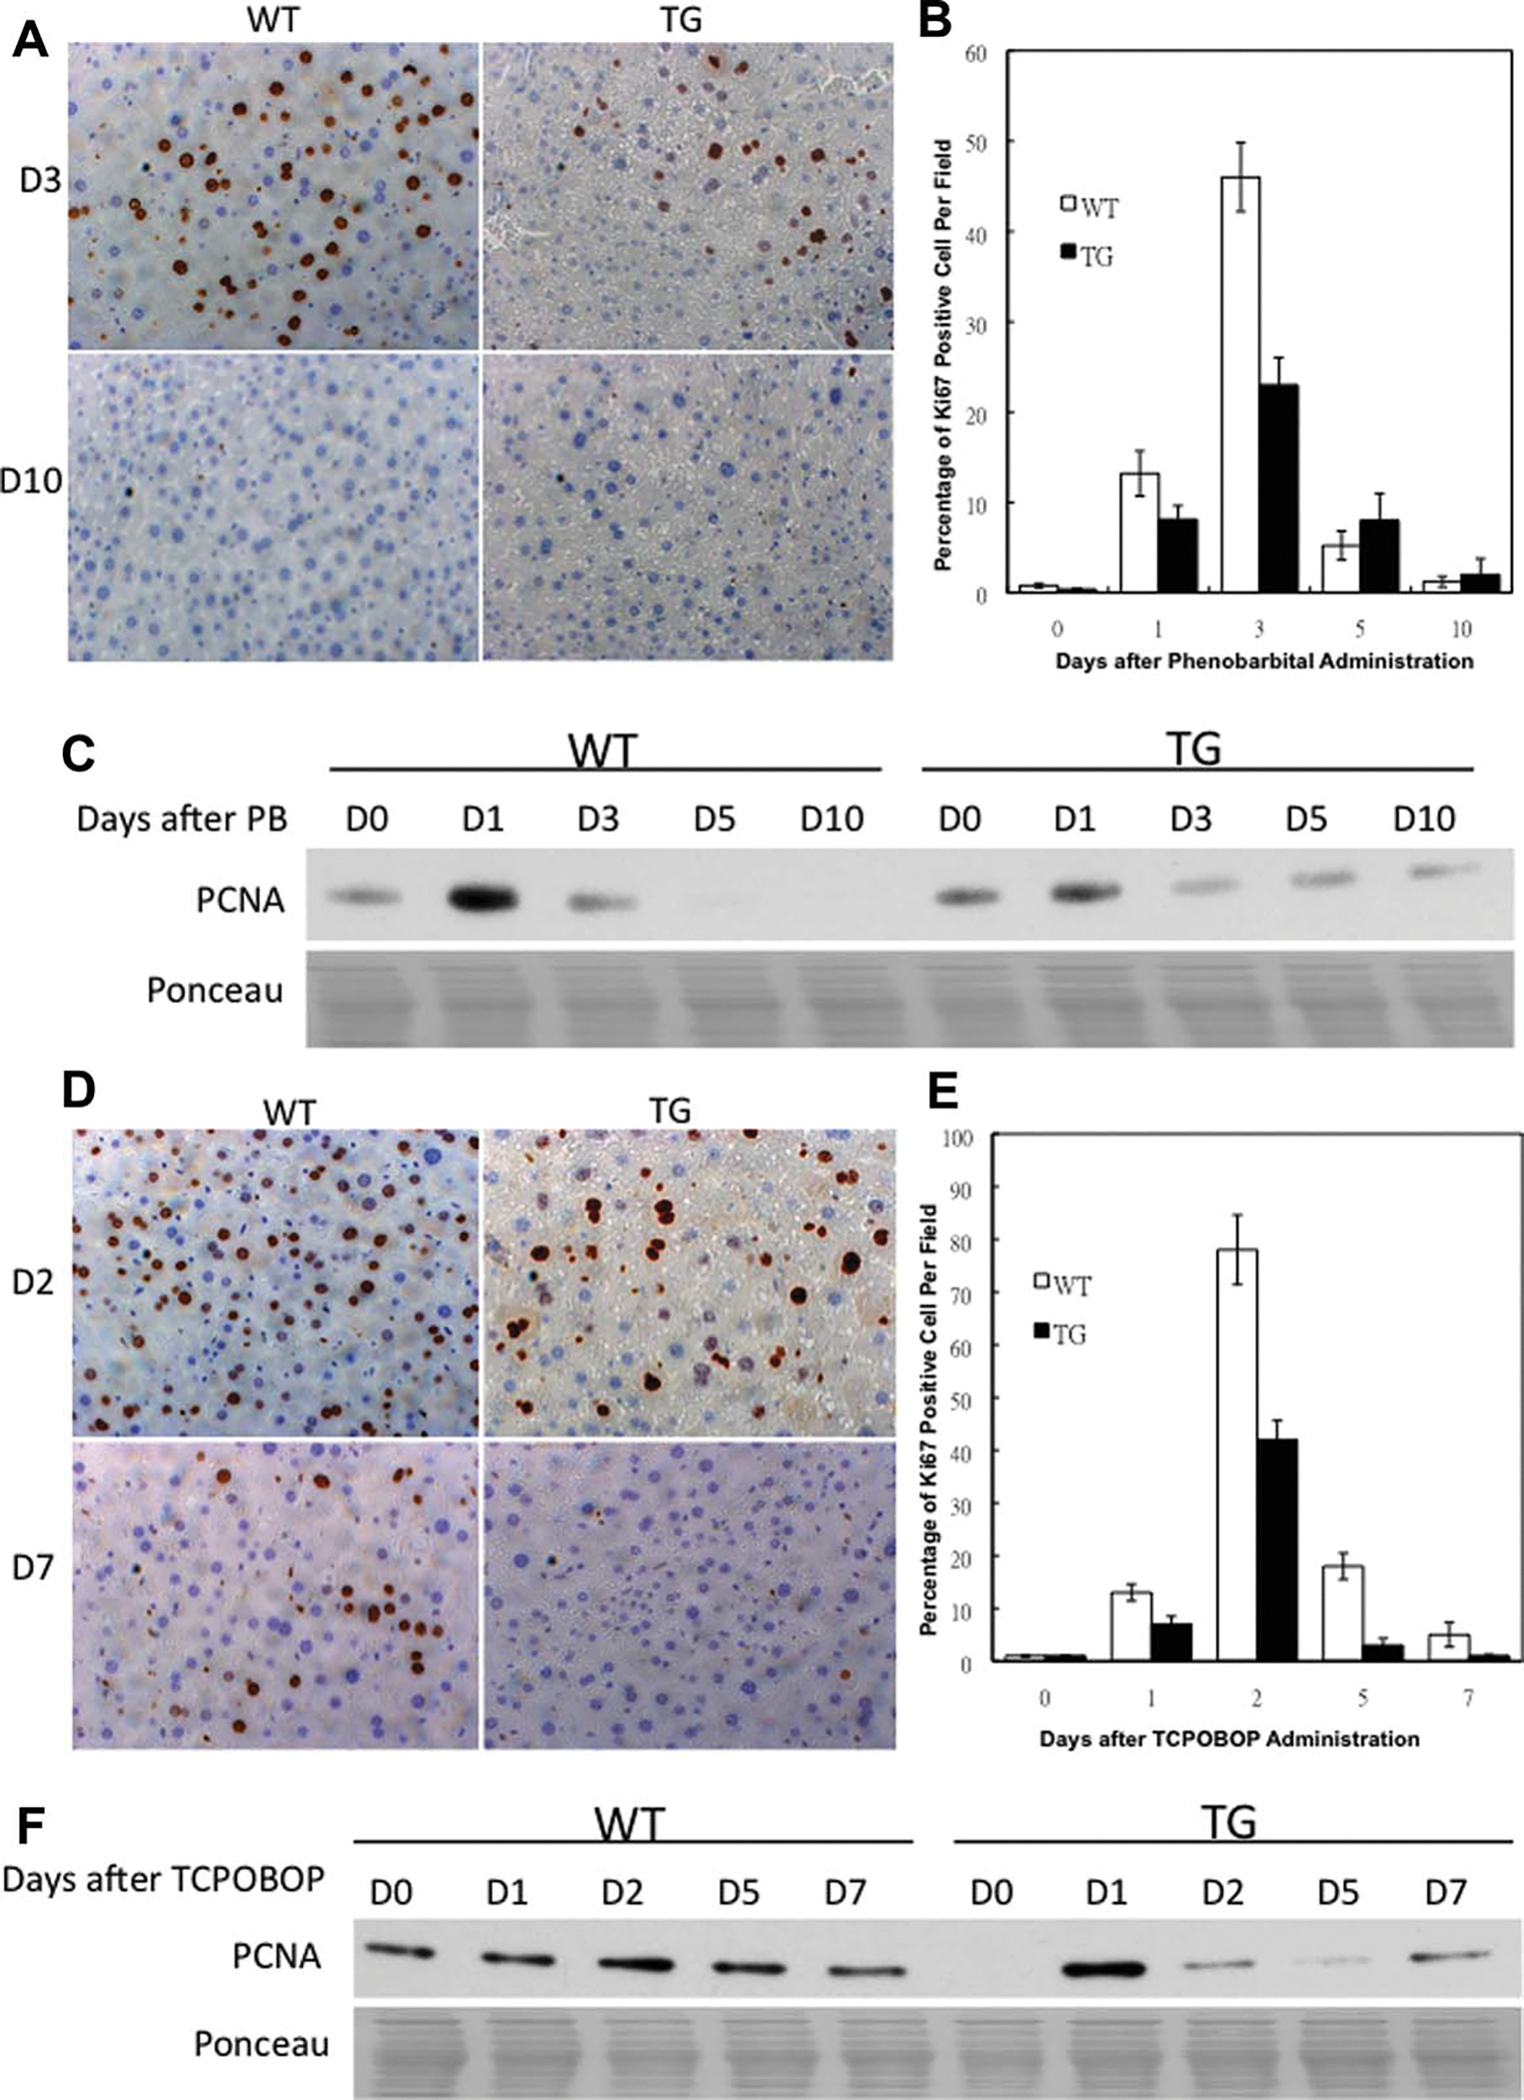
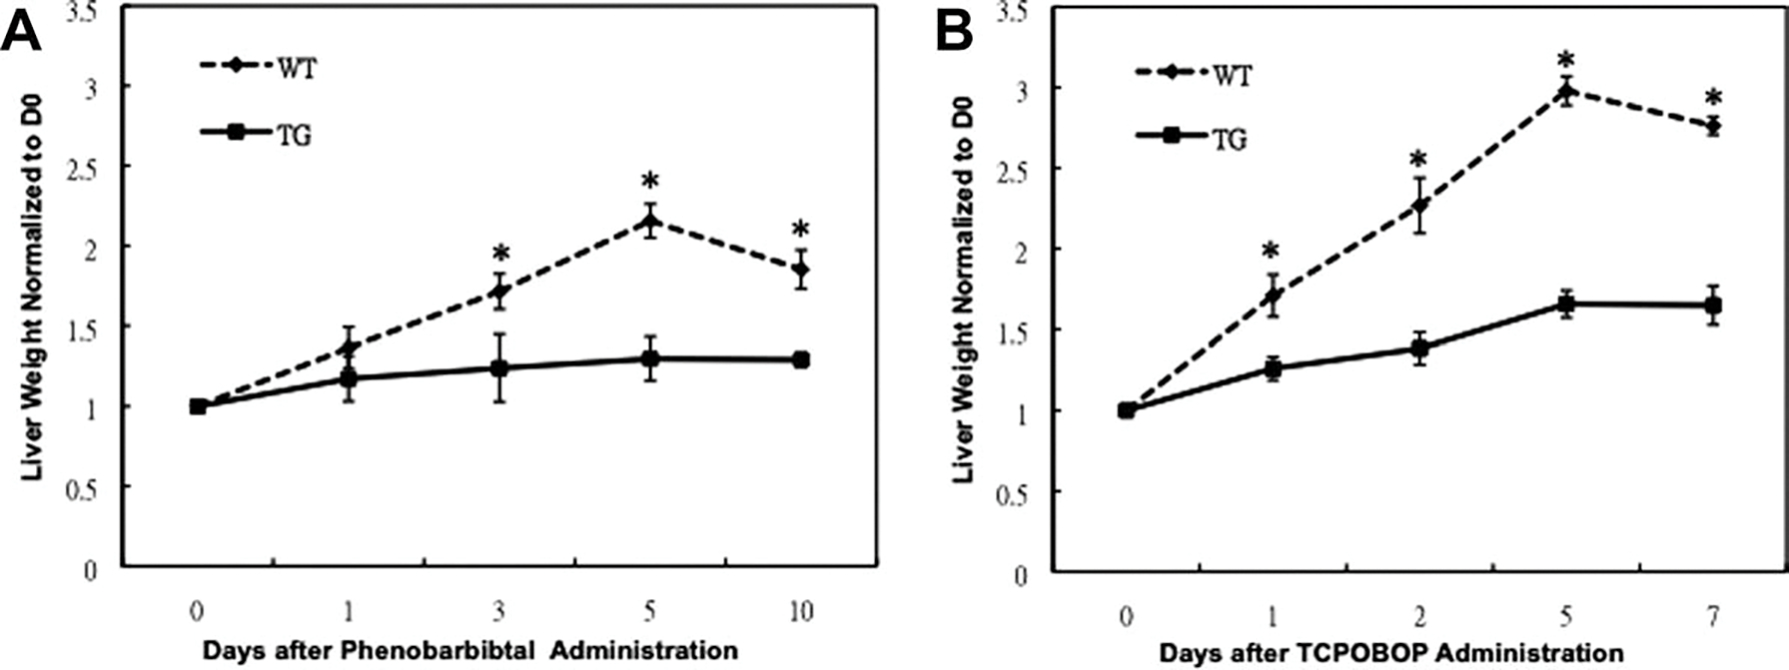
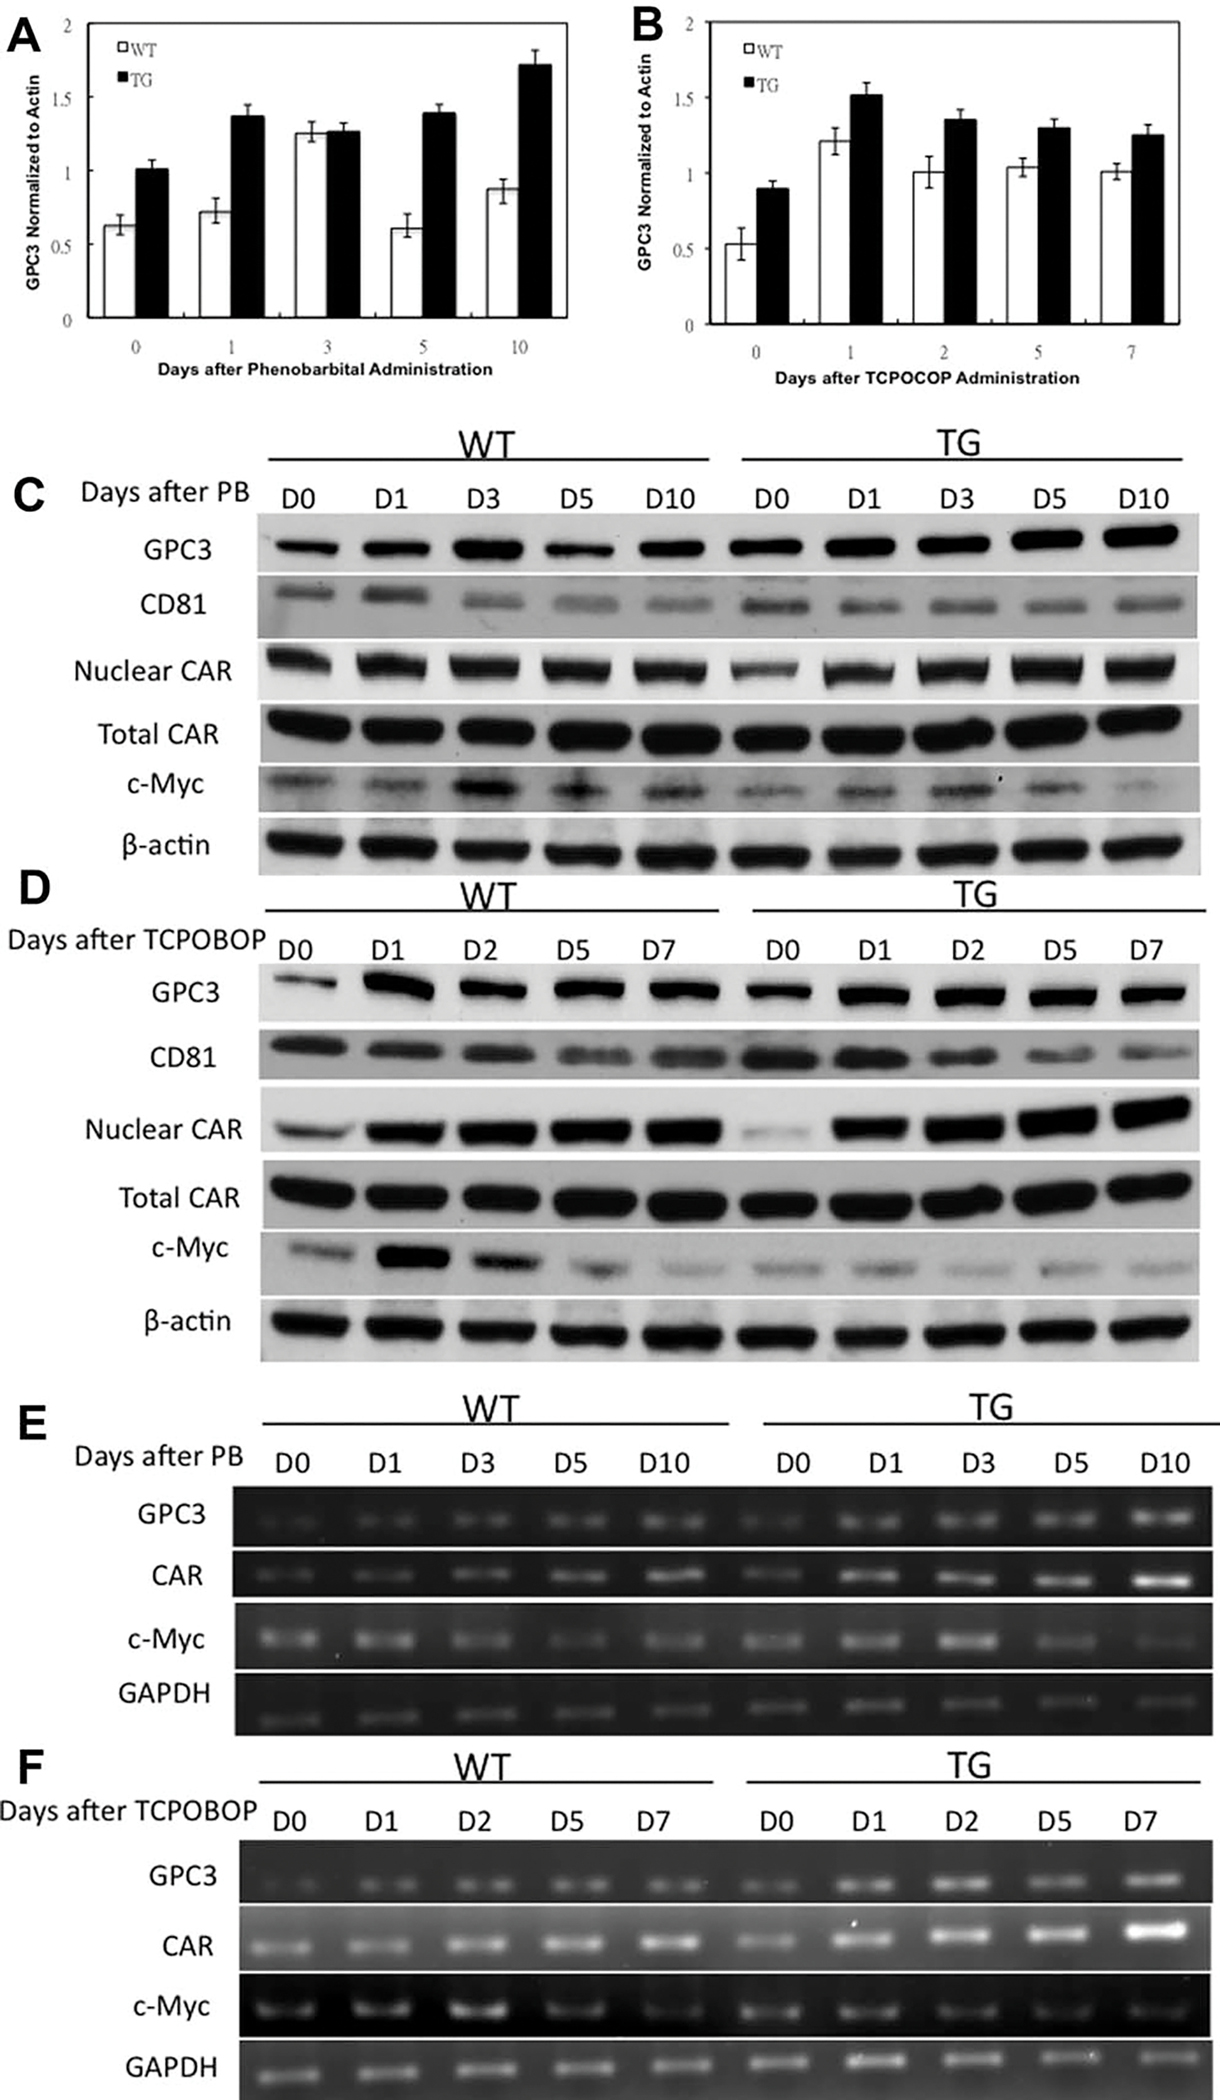
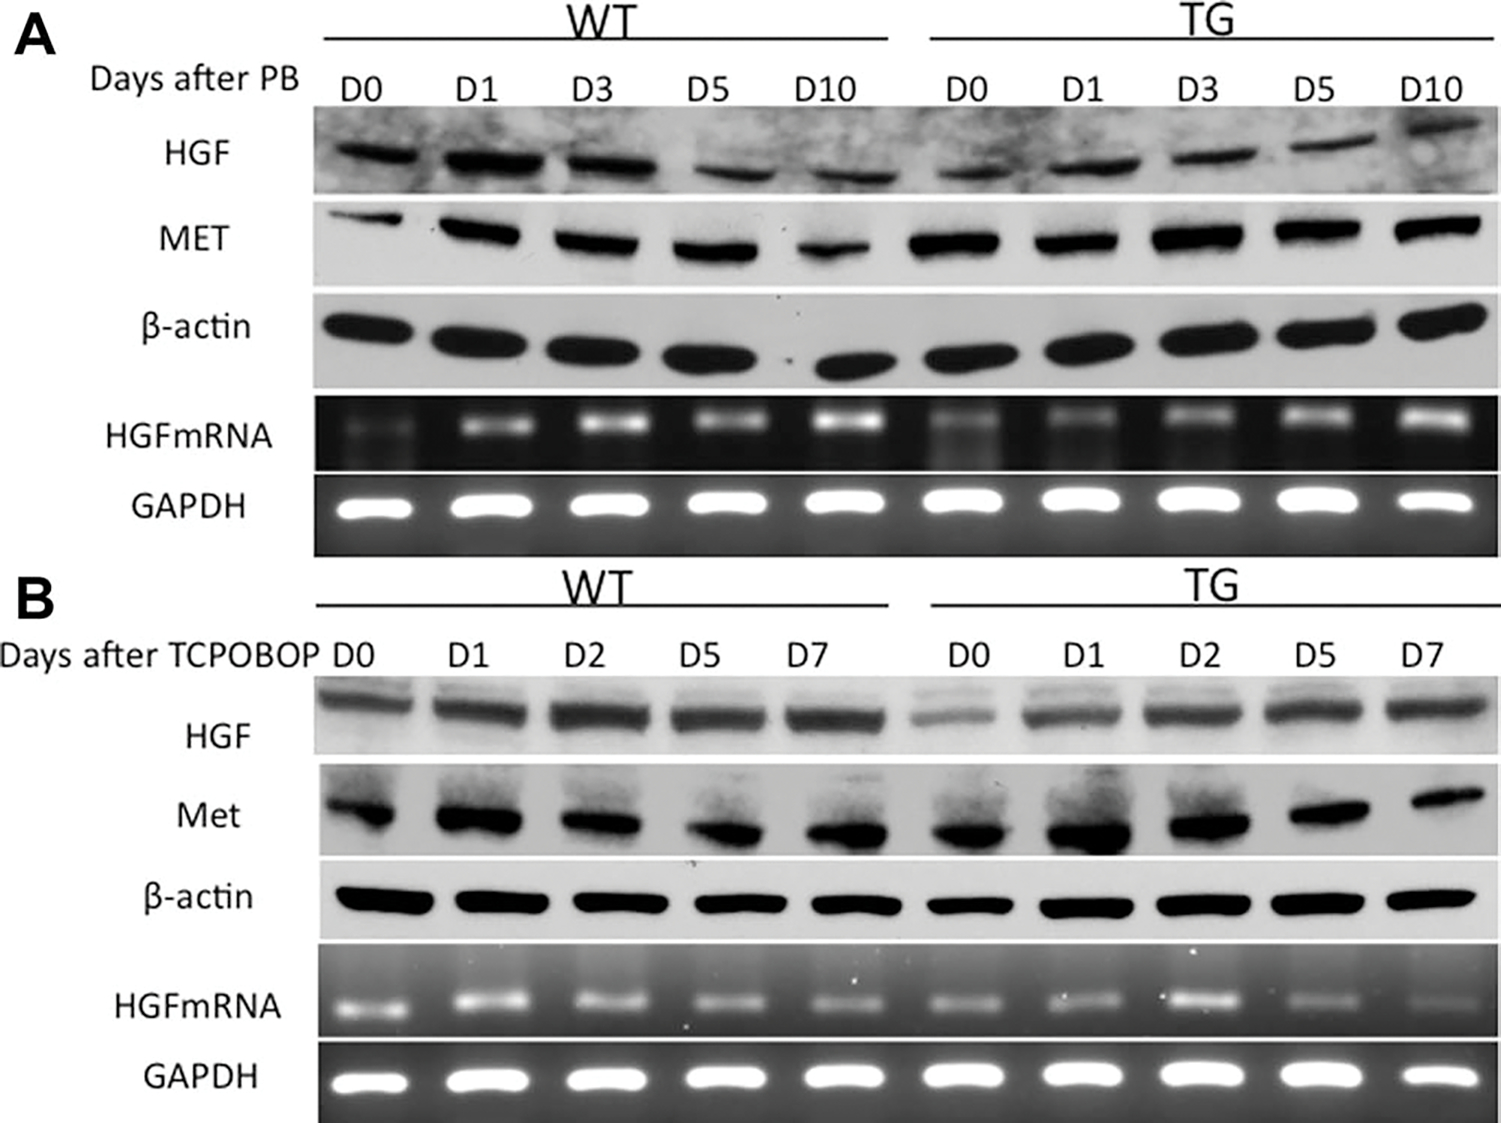
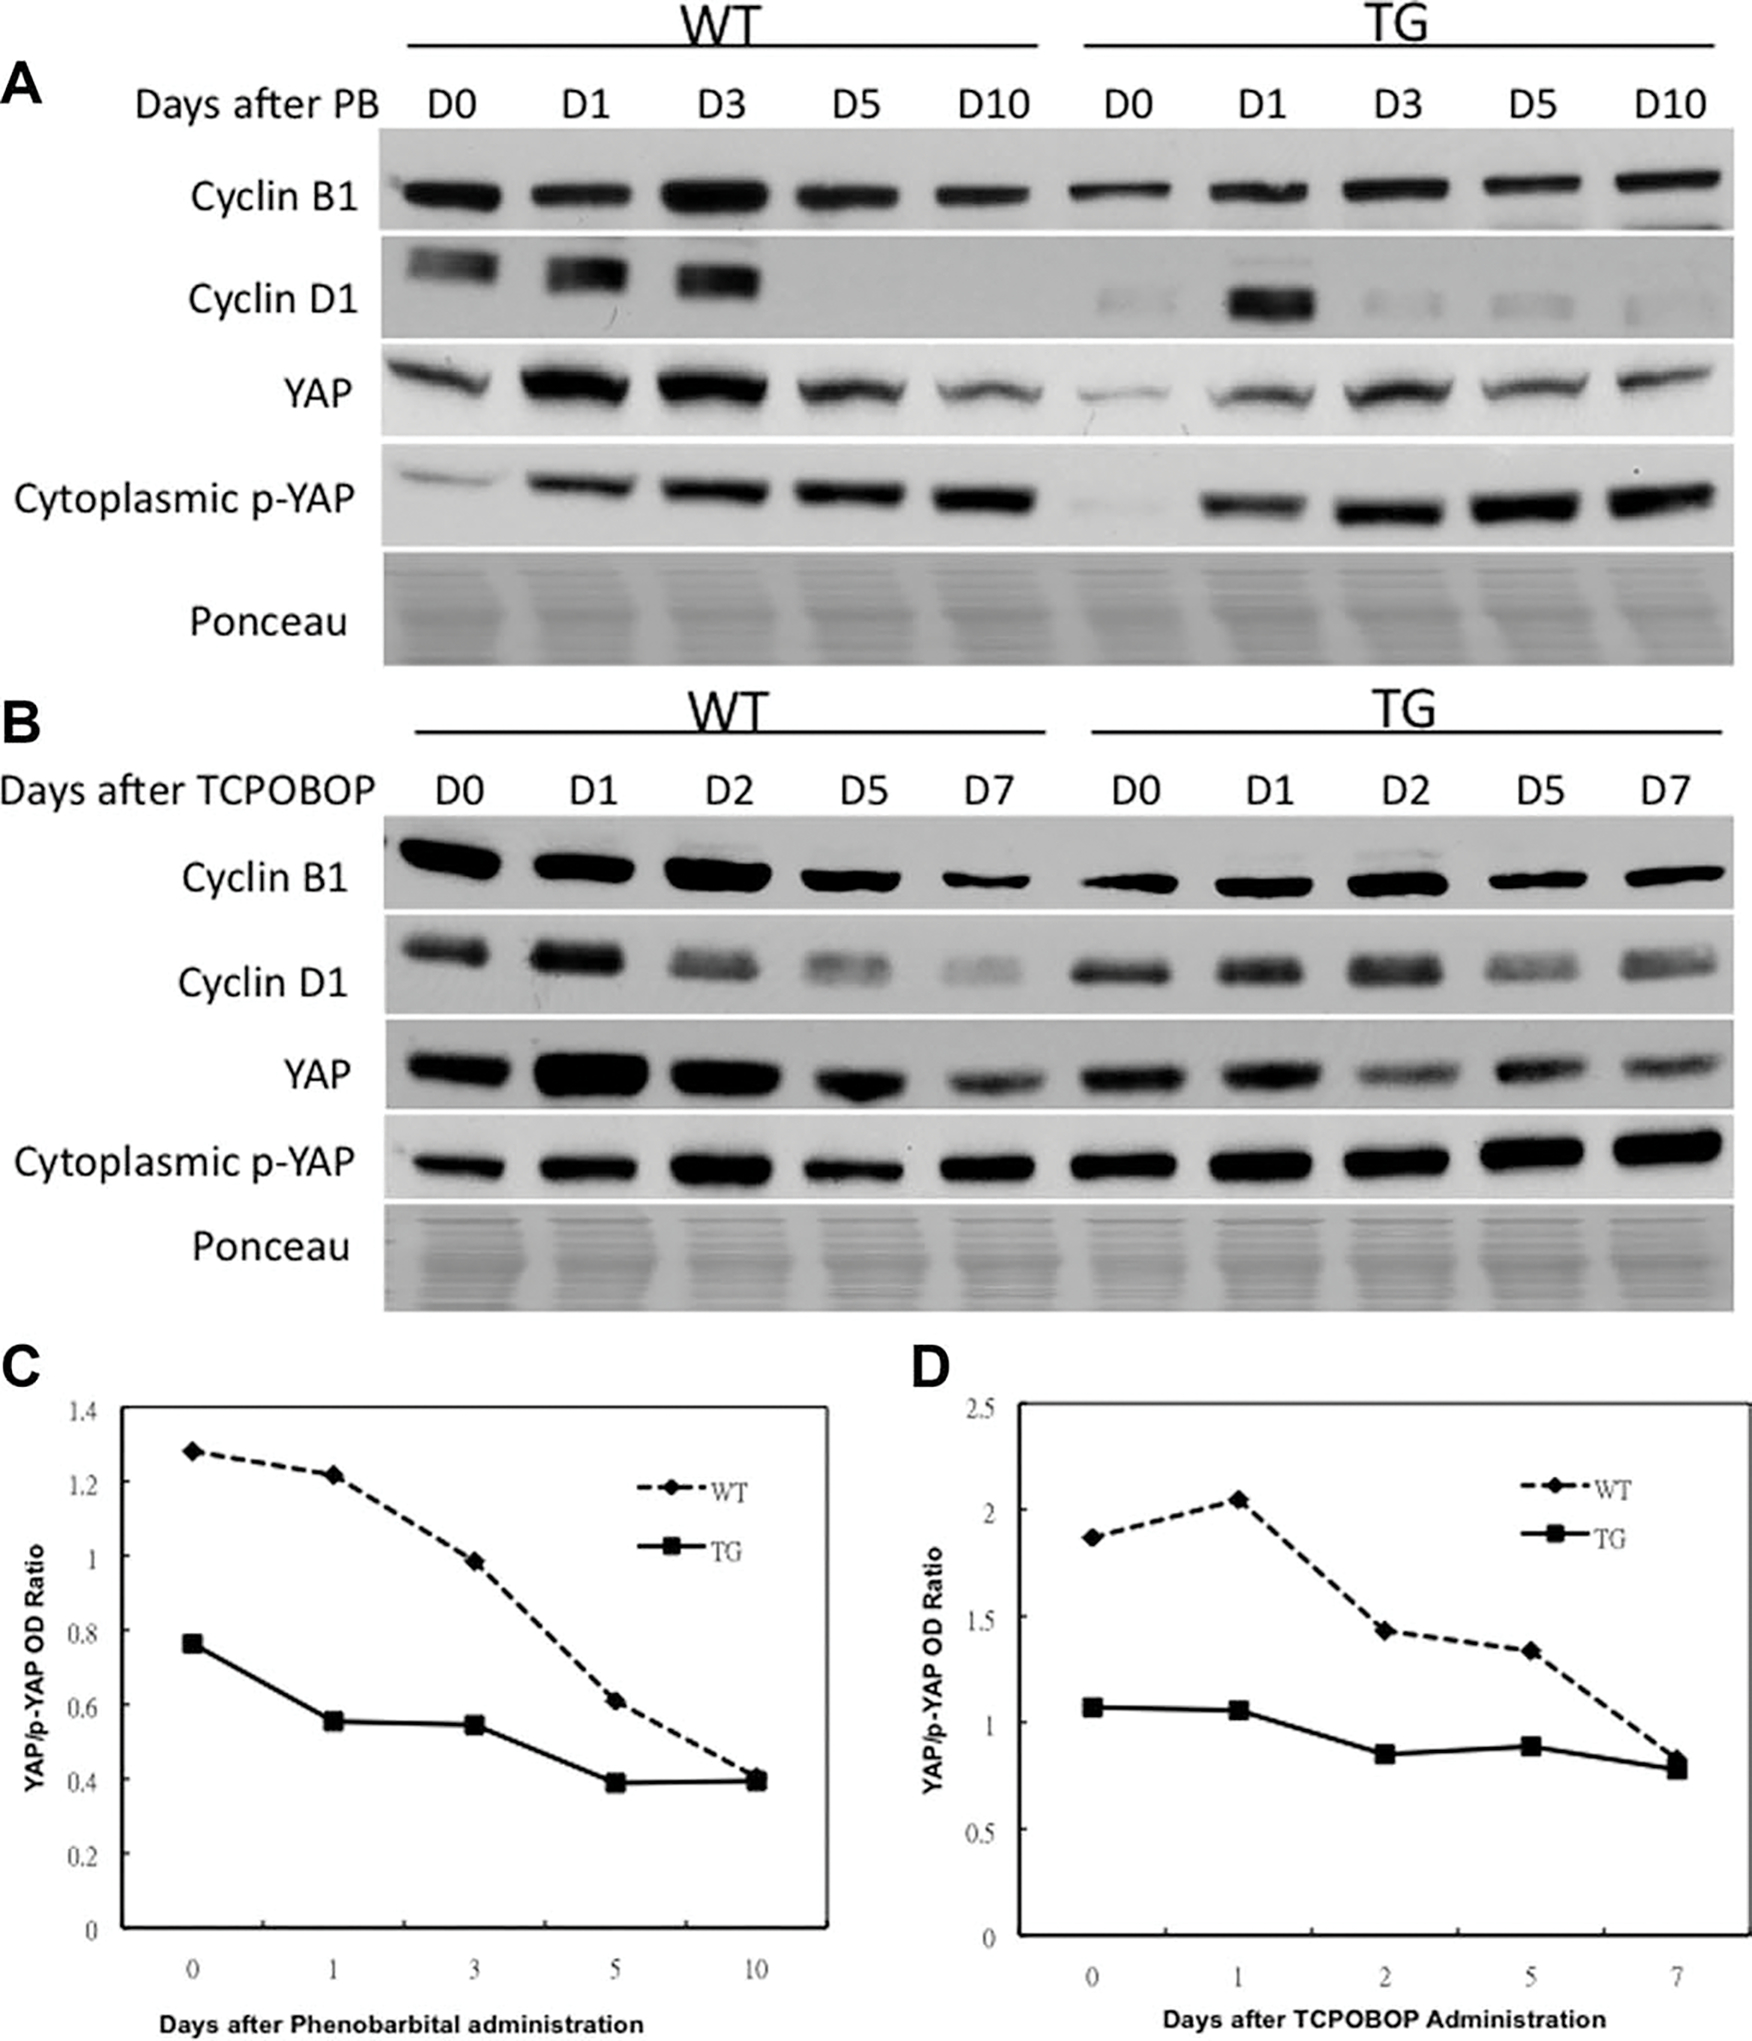
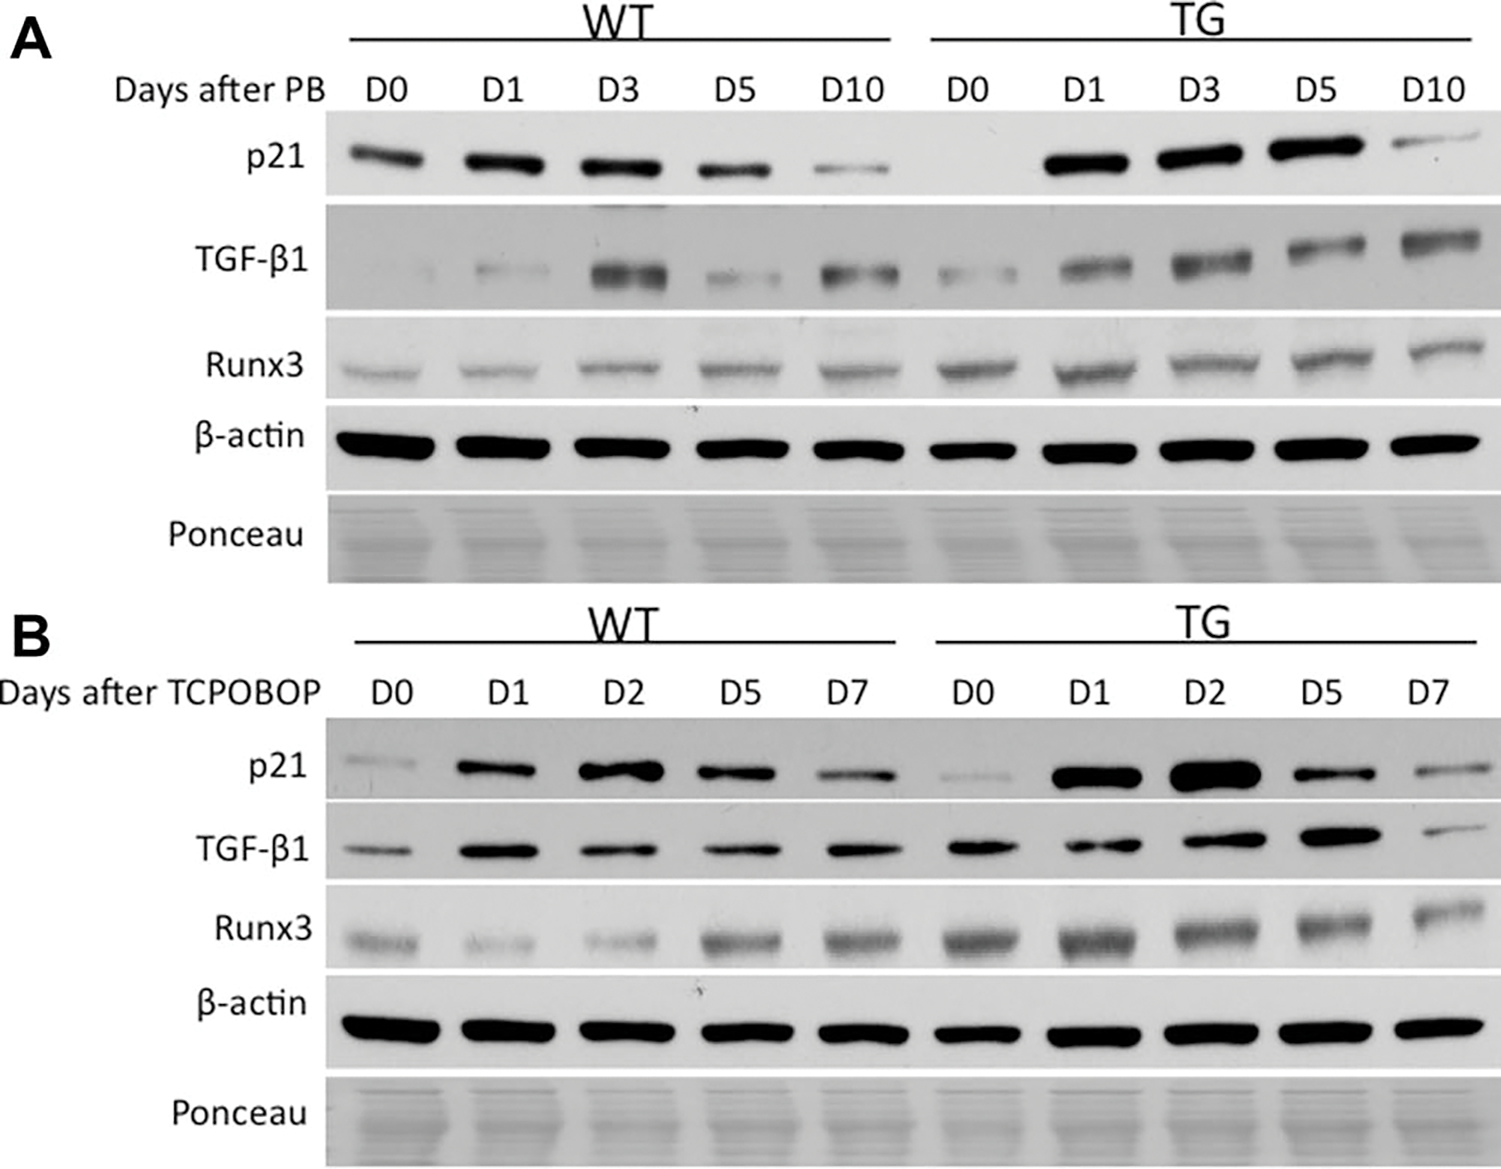
Glypican 3 (GPC3) is a family of glycosylphosphatidylinositol-anchored, cell-surface heparan sulfate proteoglycans. Loss-of-function mutations of GPC3 cause Simpson-Golabi-Behmel syndrome characterized by overgrowth of multiple organs, including liver. Our previous study showed that in GPC3 transgenic (TG) mice, hepatocyte-targeted overexpression of GPC3 suppresses hepatocyte proliferation and liver regeneration after partial hepatectomy and alters gene expression profiles and potential cell cycle-related proteins. This study investigates the role of GPC3 in hepatocyte proliferation and hepatomegaly induced by the xenobiotic mitogens phenobarbital (PB) and TCPOBOP (1, 4-bis [2-(3, 5-dichloropyridyloxy)] benzene). Wildtype (WT) and GPC3 TG mice were given 0.1% PB in drinking water for 10 days or a single dose of TCPOBOP (3 mg/kg) by oral gavage. At day 5 the WT mice showed a 2.2- and 3.0-fold increase in liver weight, whereas the GPC3 TG mice showed a 1.3- and 1.6-fold increase in liver weight after PB and TCPOBOP administration, respectively. There was a significant suppression of proliferative response in the GPC3 TG mice, as assessed by percent of Ki67-positive hepatocyte nuclei. Moreover, gene array analysis showed a panel of changes in the gene expression profile of TG mice, both before and after administration of the xenobiotic mitogens. Expression of cell cycle-related genes in the TG mice was also decreased compared to the WT mice.

Conclusion: Our results indicate that in GPC3 TG mice, hepatocyte-targeted overexpression of GPC3 plays an important role for regulation of liver size and termination of hepatocyte proliferation induced by the xenobiotic mitogens PB and TCPOBOP, comparable to the effects seen in the GPC3 TG mice during liver regeneration after partial hepatectomy.


Conflict of interest statement

Potential conflict of interest: Nothing to report.

Figures

Fig. 1.
Fig. 1.
Decreased liver growth after PB and TCPOBOP administration in GPC3 TG mice. (A,B) Statistical analysis of the liver weight normalized to day 0 (D0) liver weight in WT and GPC3 TG mice after PB and TCPOBOP administration. There were no statistically significant differences in D0 liver weight between WT and TG mice. Each data point is the mean ± standard derivation (SD) from more than three measurements per point. Asterisk indicates significantly different data between GPC3 TG and WT mice (P < 0.01).
Fig. 2.
Fig. 2.
Suppression of hepatocyte proliferation after PB and TCPOBOP administration in GPC3 TG mice. Immunohistochemical staining for Ki67 (brown), a proliferation marker, in paraffin sections of WT and TG mouse livers at days 3 and 10 after PB administration (A) and at days 2 and 7 after TCPOBOP administration (D). Percentage of Ki67-positive nuclei in hepatocyte was counted in low-power field (200×) in 15 random sections from at least three different WT and TG mice. A significant decrease in Ki-67-positive hepatocyte nuclei was observed in TG mice at day 3 after PB administration (B) and at day 2 after TCPOBOP administration (E). Western blotting analysis of PCNA. Pooled liver samples from at least three mice were used for protein analysis after PB (C) and TCPOBOP (F) administration. Ponceau staining was used as loading control for nuclear lysates.
Fig. 3.
Fig. 3.
Western blotting analysis of protein levels of several signaling molecules in WT and GPC3 TG mice. The protein levels were individually examined by western blotting after PB (A) and TCPOBOP (B) administration. The signal intensity of each protein band was quantitated with ImageJ software and was statistically analyzed. Each bar signifies the mean and standard deviation of measurements from at least three separate animals. Each measurement involved the intensity of GPC3 bands normalized to β-actin. Western blotting showing GPC3, CD81, total CAR, nuclear CAR, and nuclear c-Myc levels in pooled liver samples after PB (C) and TCPOBOP (D) administration. β-Actin was used as loading control for total cell lysates. Semi quantitative reverse-transcriptase polymerase chain analysis (RT-PCR) analysis of mRNA levels of GPC3, CAR, and c-Myc in pooled liver samples after PB (E) and TCPOBOP (F) administration. GAPDH was used as loading control for mRNA.
Fig. 4.
Fig. 4.
Protein levels of HGF and MET and mRNA levels of HGF after PB (A) and TCPOBOP (B) administration. Pooled liver samples from at least three mice were used preparing total protein lysates and mRNA. β-Actin and GAPDH were used as loading controls for total cell lysates and mRNA.
Fig. 5.
Fig. 5.
Western blotting analysis of protein levels of various cell cycle-related molecules after PB (A) and TCPOBOP (B) administration. Graphical representation of YAP/p-YAP ratio after PB (C) and TCPOBOP (D) administration. Pooled liver samples from at least three mice were used preparing cytoplasmic and nuclear lysates. Ponceau staining was used as loading control for nuclear lysates.
Fig. 6.
Fig. 6.
Western blotting analysis of protein levels of various molecules with known suppressing effects on cell cycle after PB (A) and TCPOBOP (B) administration. Pooled liver samples from at least three mice were used preparing total cell and nuclear lysates. β-Actin and Ponceau staining were used as loading controls for total cell and nuclear lysates.

References

    1. Fransson LA. Glypicans. Int J Biochem Cell Biol 2003;35:125–129. - PubMed
    1. Filmus J, Selleck SB. Glypicans: proteoglycans with a surprise. J Clin Invest 2001;108:497–501. - PMC - PubMed
    1. Song HH, Filmus J. The role of glypicans in mammalian development. Biochim Biophys Acta 2002;1573:241–246. - PubMed
    1. Filmus J Glypicans in growth control and cancer. Glycobiology 2001;11:19R–23R. - PubMed
    1. Iglesias BV, Centeno G, Pascuccelli H, Ward F, Peters MG, Filmus J, et al. Expression pattern of glypican-3 (GPC3) during human embryonic and fetal development. Histol Histopathol 2008;23:1333–1340. - PubMed

Publication types