Comparative Study
. 2011 May 15:10:34.
doi: 10.1186/1476-072X-10-34.

An application of the edge effect in measuring accessibility to multiple food retailer types in southwestern Ontario, Canada

Affiliations
Comparative Study

An application of the edge effect in measuring accessibility to multiple food retailer types in southwestern Ontario, Canada

Richard C Sadler et al. Int J Health Geogr. .

Abstract

Background: Trends in food retailing associated with the consolidation of smaller-format retailers into fewer, larger-format supercentres have left some rural areas with fewer sources of nutritious, affordable food. Access to nutritious, affordable food is essential for good dietary habits and combating health issues such as type-2 diabetes, obesity, and cardiovascular disease. Many studies on food environments use inaccurate or incomplete methods for locating food retailers, which may be responsible for mischaracterising food deserts. This study uses databases of every residence in and every food retailer in and around Middlesex County, Ontario, Canada. Residences were geocoded to their precise address, and network analysis techniques were performed in a geographic information system (GIS) to determine distances between every residence and different types of food retailers (grocery stores, fast food, fruit and vegetable sources, grocery stores plus fruit and vegetable sources, variety stores), both when considering and neglecting facilities outside the area of study, to account for a deficiency in analysis termed the 'edge effect'.

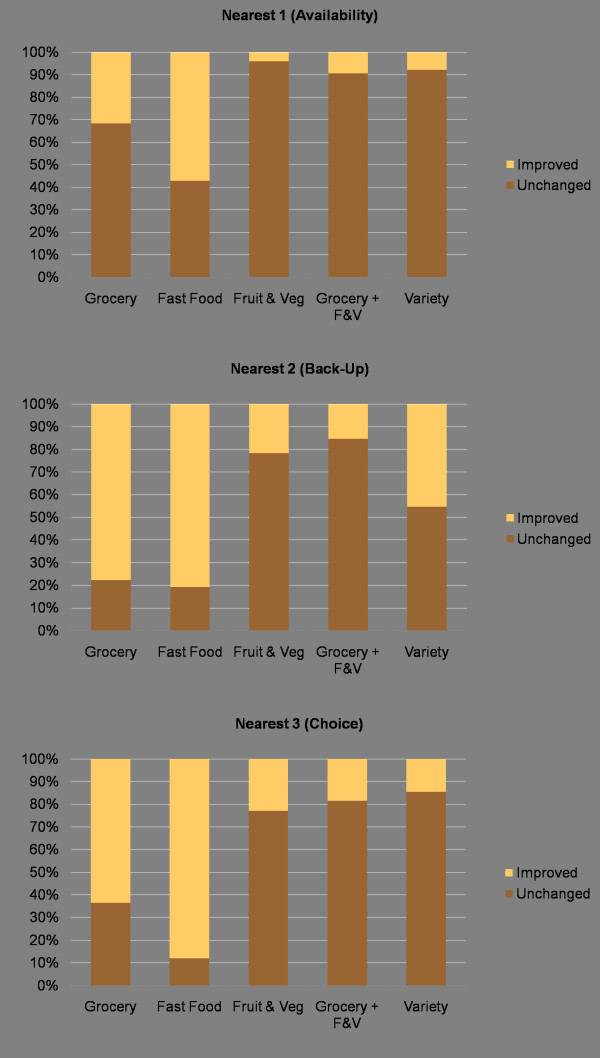
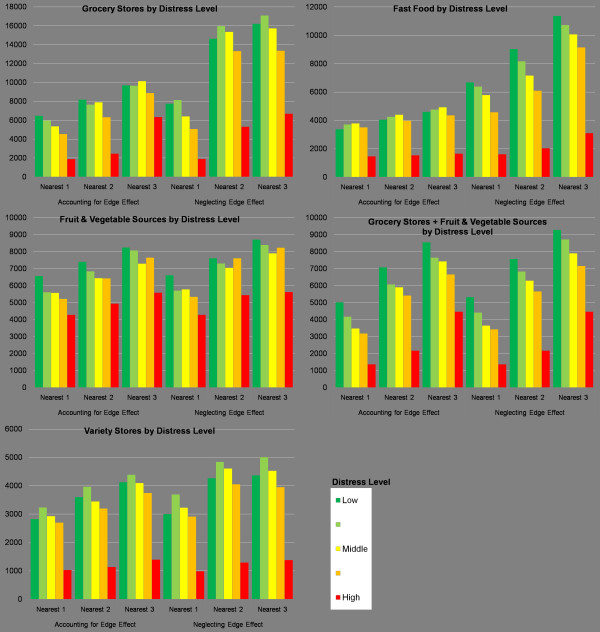
Results: Analysis of household accessibility to food outlets by neighbourhood socioeconomic distress level indicated that residents in the most distressed neighbourhoods tended to have better accessibility to all types of food retailers. In the most distressed neighbourhoods, 79 percent of residences were within walking distance of a grocery store, compared to only 10 percent in the least distressed neighbourhoods. When the edge effect was neglected, 37 percent of distance estimates proved inaccurate. Average accessibility to all food retailer types improved dramatically when food outlets adjacent to the study area were considered, thereby controlling for the edge effect.

Conclusion: By neglecting to consider food retailers just outside study area boundaries, previous studies may significantly over-report the actual distance necessary to travel for food. Research on food access spanning large rural regions requires methods that accurately geocode residents and their food sources. By implementing methods akin to those in this paper, future research will be better able to identify areas with poor food accessibility. Improving identification of food desert communities is a first step in facilitating more effective deployment of food policies and programs in those communities.


Figures

Figure 1
Figure 1
Middlesex County, Ontario, 2010. This map includes county boundaries, grocery stores within and outside the county, public transit lines, settlements, and roads.
Figure 2
Figure 2
Distance to grocery stores from individual address points when accounting for edge effect. The network distance from individual address points to the nearest 1, 2, and 3 grocery stores was calculated and displayed using various thresholds. This indicates that for some residents, accessibility to 1 grocery store may be good, but accessibility to 2 may be problematic.
Figure 3
Figure 3
Distance to fruit and vegetable sources from individual address points when accounting for edge effect. The network distance from individual address points to the nearest 1, 2, and 3 fruit and vegetable sources was calculated and displayed using various thresholds. These sources include both grocery stores and seasonal produce stands classified as fruit and vegetable sources.
Figure 4
Figure 4
Average distance (metres) to nearest 1, 2, and 3 food sources by type. This figure indicates the distances to various food sources when accounting for or neglecting the edge effect. In every pair, the average distance to food sources is greater when neglecting the edge effect, since certain food sources are omitted from analysis. Paired t-tests indicate that the difference between distances when accounting for or neglecting the edge effect is significant for all food source types.
Figure 5
Figure 5
Distance to grocery stores from individual address points when neglecting edge effect. The network distance from individual address points to the nearest 1, 2, and 3 grocery stores was calculated and displayed using various thresholds. When compared to Figure 2, this indicates large apparent differences in accessibility when neglecting the edge effect.
Figure 6
Figure 6
Distance to fruit and vegetable sources from individual address points when neglecting edge effect. The network distance from individual address points to the nearest 1, 2, and 3 fruit and vegetable sources was calculated and displayed using various thresholds. When compared to Figure 3, this indicates large apparent differences in accessibility when neglecting the edge effect.
Figure 7
Figure 7
Percent of residential addresses with improved accessibility to food when accounting for the edge effect. When accounting for food sources outside the area of study, many address points see improved accessibility scores. The change is exemplified by the large number of addresses with improved accessibility to grocery stores and fast food, suggesting that omitting food sources will mischaracterise many neighbourhoods.
Figure 8
Figure 8
Average distance (metres) to closest food retailers by type and distress level. The most distressed neighbourhoods tend to have the best access to all food sources. When neglecting the edge effect, calculated distance values are always farther, which may have the effect of mischaracterising some neighbourhoods as food deserts.
Figure 9
Figure 9
Proportion of residences by distress level and accessibility to the nearest grocery store. A majority of residents in the most distressed neighbourhoods are within walking distance of a grocery store. In contrast, most residents in the least distressed neighbourhoods are not within walking distance of the nearest grocery store.

Similar articles

Cited by

References

    1. Lavin M. Problems and opportunities of retailing in the US "Inner City". J Retailing Cons Serv. 2000;7:47–57. doi: 10.1016/S0969-6989(99)00017-X. - DOI
    1. Wrigley N. Transforming the Corporate Landscape of US Food Retailing: Market Power, Financial Re-Engineering and Regulation. Tijdschr Econ Soc Geogr. 2001;93:62–82.
    1. Pothukuchi K. Attracting supermarkets to Inner-City Neighborhoods: Economic Development Outside the Box. Econ Dev Q. 2005;19:232–244. doi: 10.1177/0891242404273517. - DOI
    1. Kaufman PR. Rural Poor Have Less Access to Supermarkets, Large Grocery Stores. Rural Devel Perspect. 1998;13:19–26.
    1. Wang MC, Kim S, Gonzalez AA, MacLeod KE, Winkleby MA. Socioeconomic and food-related physical characteristics of the neighbourhood environment are associated with body mass index. J Epidemiol Community Health. 2007;61:491–498. doi: 10.1136/jech.2006.051680. - DOI - PMC - PubMed

Publication types