

Prevalence and tracking of back pain from childhood to adolescence
- PMID: 21575251
- PMCID: PMC3123615
- DOI: 10.1186/1471-2474-12-98
Prevalence and tracking of back pain from childhood to adolescence
Abstract
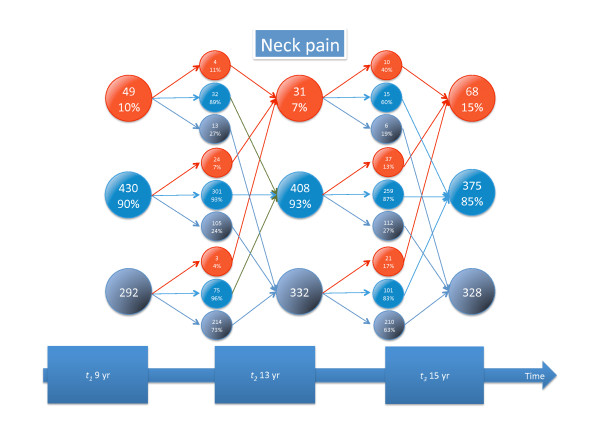
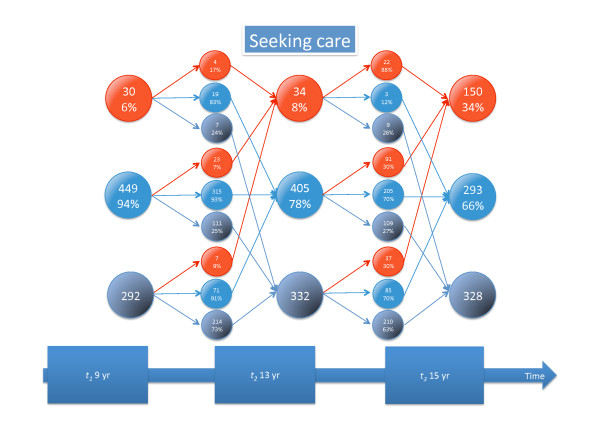
Background: It is generally acknowledged that back pain (BP) is a common condition already in childhood. However, the development until early adulthood is not well understood and, in particular, not the individual tracking pattern. The objectives of this paper are to show the prevalence estimates of BP, low back pain (LBP), mid back pain (MBP), neck pain (NP), and care-seeking because of BP at three different ages (9, 13 and 15 years) and how the BP reporting tracks over these age groups over three consecutive surveys.
Methods: A longitudinal cohort study was carried out from the years of 1997 till 2005, collecting interview data from children who were sampled to be representative of Danish schoolchildren. BP was defined overall and specifically in the three spinal regions as having reported pain within the past month. The prevalence estimates and the various patterns of BP reporting over time are presented as percentages.
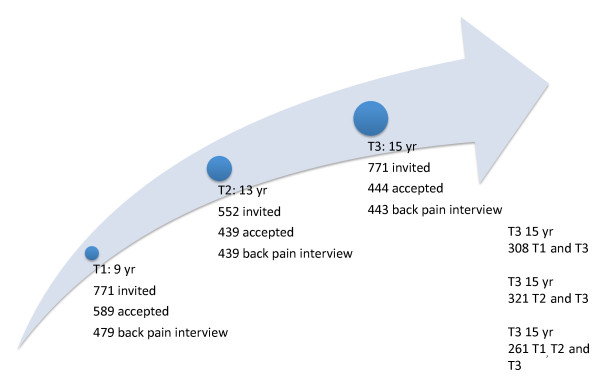
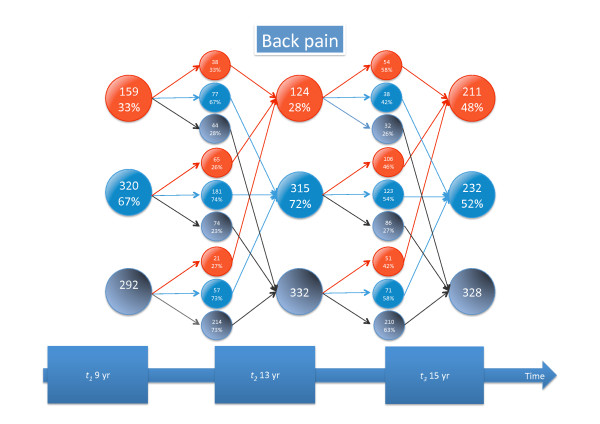
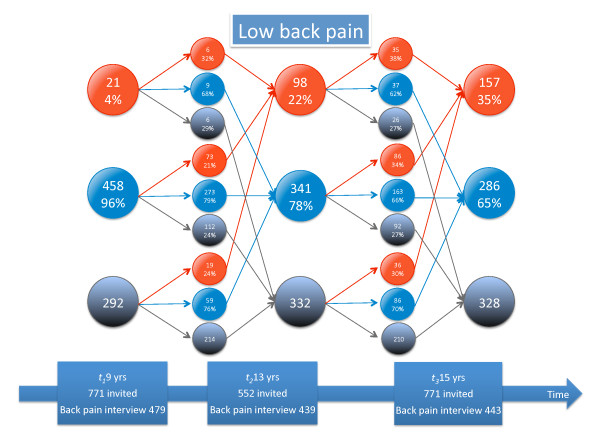
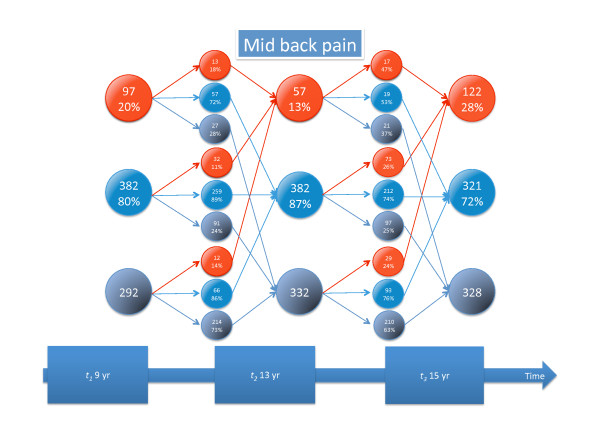
Results: Of the 771 children sampled, 62%, 57%, and 58% participated in the three back surveys and 34% participated in all three. The prevalence estimates for children at the ages of 9, 13, and 15, respectively, were for BP 33%, 28%, and 48%; for LBP 4%, 22%, and 36%; for MBP 20%, 13%, and 35%; and for NP 10%, 7%, and 15%. Seeking care for BP increased from 6% and 8% at the two youngest ages to 34% at the oldest. Only 7% of the children who participated in all three surveys reported BP each time and 30% of these always reported no pain. The patterns of development differed for the three spinal regions and between genders. Status at the previous survey predicted status at the next survey, so that those who had pain before were more likely to report pain again and vice versa. This was most pronounced for care-seeking.
Conclusion: It was confirmed that BP starts early in life, but the patterns of onset and development over time vary for different parts of the spine and between genders. Because of these differences, it is recommended to report on BP in youngsters separately for the three spinal regions, and to differentiate in the analyses between the genders and age groups. Although only a small minority reported BP at two or all three surveys, tracking of BP (particularly NP) and care seeking was noted from one survey to the other. On the positive side, individuals without BP at a previous survey were likely to remain pain free at the subsequent survey.
Figures


References
-
- Burton AK. Low back pain in children and adolescents: to treat or not? Bull Hosp Jt Dis. 1996;12:127–129. - PubMed
MeSH terms
LinkOut - more resources
Full Text Sources
Medical
Miscellaneous
